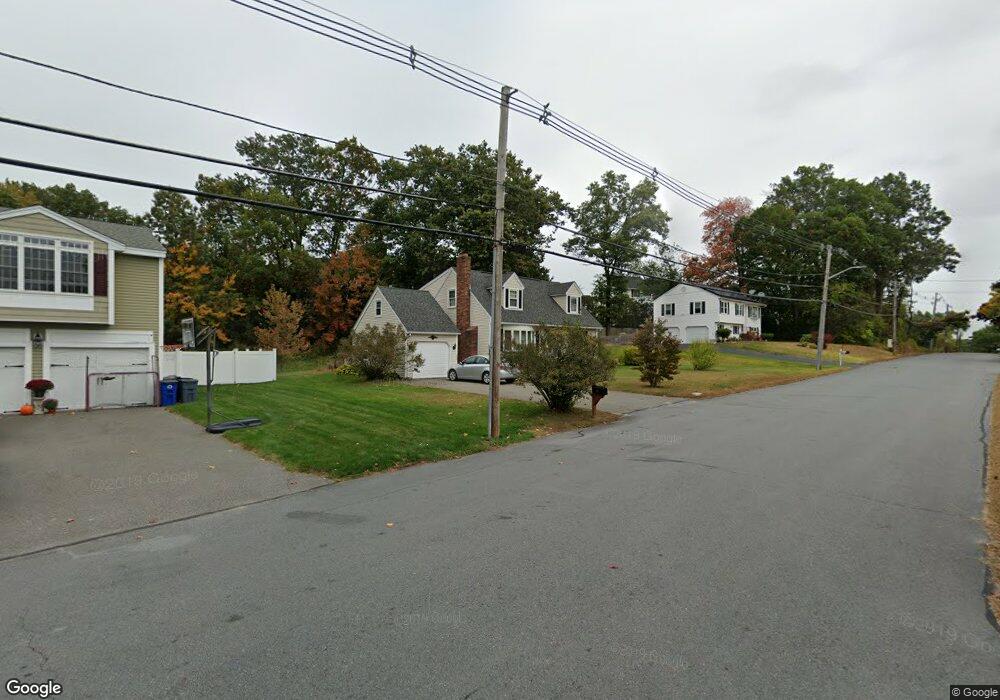
146 Pitman St Methuen, MA 01844
The East End NeighborhoodEstimated Value: $590,427 - $686,000
3
Beds
2
Baths
1,577
Sq Ft
$404/Sq Ft
Est. Value
About This Home
This home is located at 146 Pitman St, Methuen, MA 01844 and is currently estimated at $636,857, approximately $403 per square foot. 146 Pitman St is a home located in Essex County with nearby schools including South Point Elementary School, Methuen High School, and Community Day Charter Public School - Gateway.
Ownership History
Date
Name
Owned For
Owner Type
Purchase Details
Closed on
Aug 26, 1992
Sold by
Narrigan James M
Bought by
Corrigan Kevin J
Current Estimated Value
Home Financials for this Owner
Home Financials are based on the most recent Mortgage that was taken out on this home.
Original Mortgage
$146,000
Interest Rate
8.09%
Mortgage Type
Purchase Money Mortgage
Create a Home Valuation Report for This Property
The Home Valuation Report is an in-depth analysis detailing your home's value as well as a comparison with similar homes in the area
Home Values in the Area
Average Home Value in this Area
Purchase History
| Date | Buyer | Sale Price | Title Company |
|---|---|---|---|
| Corrigan Kevin J | $146,000 | -- | |
| Corrigan Kevin J | $146,000 | -- |
Source: Public Records
Mortgage History
| Date | Status | Borrower | Loan Amount |
|---|---|---|---|
| Open | Corrigan Kevin J | $78,000 | |
| Open | Corrigan Kevin J | $168,000 | |
| Closed | Corrigan Kevin J | $146,000 |
Source: Public Records
Tax History Compared to Growth
Tax History
| Year | Tax Paid | Tax Assessment Tax Assessment Total Assessment is a certain percentage of the fair market value that is determined by local assessors to be the total taxable value of land and additions on the property. | Land | Improvement |
|---|---|---|---|---|
| 2025 | $5,335 | $504,300 | $208,000 | $296,300 |
| 2024 | $5,388 | $496,100 | $189,700 | $306,400 |
| 2023 | $5,015 | $428,600 | $168,600 | $260,000 |
| 2022 | $4,750 | $364,000 | $140,500 | $223,500 |
| 2021 | $4,516 | $342,400 | $133,500 | $208,900 |
| 2020 | $4,523 | $336,500 | $133,500 | $203,000 |
| 2019 | $4,704 | $331,500 | $119,400 | $212,100 |
| 2018 | $4,569 | $320,200 | $119,400 | $200,800 |
| 2017 | $4,386 | $299,400 | $119,400 | $180,000 |
| 2016 | $4,073 | $275,000 | $112,400 | $162,600 |
| 2015 | $3,889 | $266,400 | $112,400 | $154,000 |
Source: Public Records
Map
Nearby Homes
- 45 Christopher Dr Unit 101
- 17 Ferry Rd
- 29 Pitman St
- 29 Wallace St
- 2 Goodrich Ave
- 27 Russell Farm Dr
- 23 Constitution Way Unit 23
- 23 Constitution Way
- 95 Pilgrim Cir Unit 95
- 107 Farrwood Dr Unit 107
- 49 Golf Ave
- 369 Farrwood Dr
- 68 Sterling Ln
- 406 Farrwood Dr Unit 406
- 414 Farrwood Dr Unit 414
- 86 Comet Rd
- 128 Bradford St
- 128 Pleasant Valley St
- 14 S Riverview St
- 49 Ferry Rd