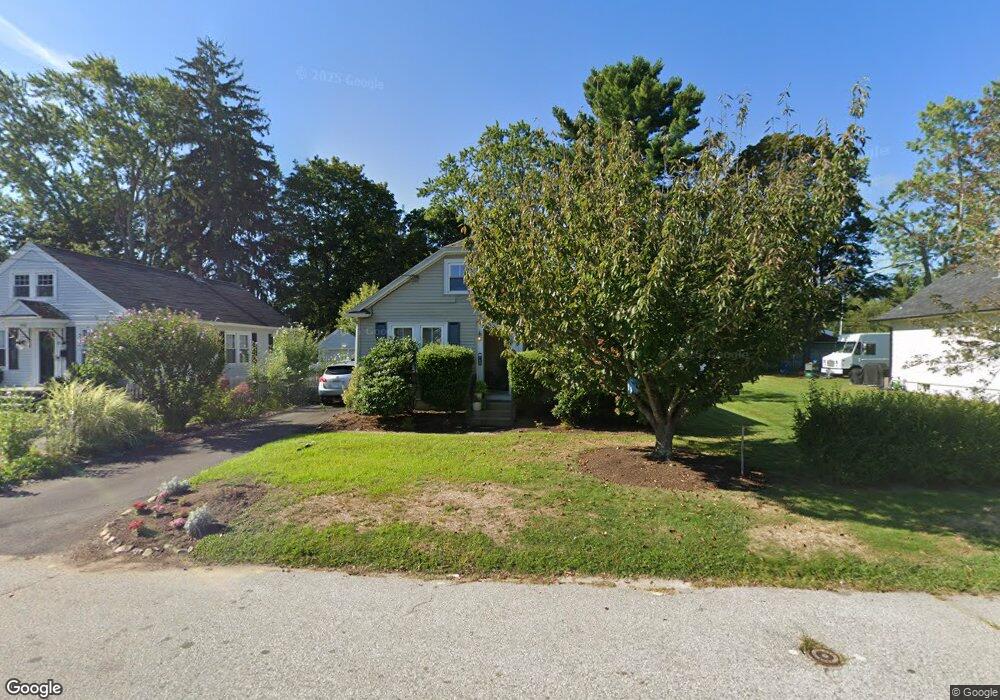
146 Potters Ave Warwick, RI 02886
Greenwood NeighborhoodEstimated Value: $357,000 - $412,000
2
Beds
1
Bath
792
Sq Ft
$489/Sq Ft
Est. Value
About This Home
This home is located at 146 Potters Ave, Warwick, RI 02886 and is currently estimated at $387,646, approximately $489 per square foot. 146 Potters Ave is a home located in Kent County with nearby schools including St Rose Of Lima School and Eleanor Briggs School.
Ownership History
Date
Name
Owned For
Owner Type
Purchase Details
Closed on
Sep 11, 2009
Sold by
Morris Brian M
Bought by
Dantuono Gina E
Current Estimated Value
Home Financials for this Owner
Home Financials are based on the most recent Mortgage that was taken out on this home.
Original Mortgage
$176,739
Interest Rate
5.36%
Mortgage Type
Purchase Money Mortgage
Purchase Details
Closed on
Apr 2, 2009
Sold by
Wm Specialty Mortgage
Bought by
Morris Brian M
Home Financials for this Owner
Home Financials are based on the most recent Mortgage that was taken out on this home.
Original Mortgage
$83,000
Interest Rate
4.92%
Mortgage Type
Purchase Money Mortgage
Purchase Details
Closed on
Feb 19, 2009
Sold by
Fry Judy and Jp Morgan Chase Bank N
Bought by
Wm Specialty Mortgage
Home Financials for this Owner
Home Financials are based on the most recent Mortgage that was taken out on this home.
Original Mortgage
$83,000
Interest Rate
4.92%
Mortgage Type
Purchase Money Mortgage
Purchase Details
Closed on
May 1, 2006
Sold by
Gilmartin Betty Lou
Bought by
Fry Judy
Create a Home Valuation Report for This Property
The Home Valuation Report is an in-depth analysis detailing your home's value as well as a comparison with similar homes in the area
Home Values in the Area
Average Home Value in this Area
Purchase History
| Date | Buyer | Sale Price | Title Company |
|---|---|---|---|
| Dantuono Gina E | $180,000 | -- | |
| Morris Brian M | $81,500 | -- | |
| Jpmc Speciality Mtg Ll | $131,750 | -- | |
| Wm Specialty Mortgage | $131,750 | -- | |
| Fry Judy | $226,000 | -- |
Source: Public Records
Mortgage History
| Date | Status | Borrower | Loan Amount |
|---|---|---|---|
| Open | Fry Judy | $169,413 | |
| Closed | Fry Judy | $176,739 | |
| Previous Owner | Fry Judy | $83,000 |
Source: Public Records
Tax History Compared to Growth
Tax History
| Year | Tax Paid | Tax Assessment Tax Assessment Total Assessment is a certain percentage of the fair market value that is determined by local assessors to be the total taxable value of land and additions on the property. | Land | Improvement |
|---|---|---|---|---|
| 2025 | $4,521 | $356,000 | $132,200 | $223,800 |
| 2024 | $4,199 | $290,200 | $115,000 | $175,200 |
| 2023 | $4,115 | $290,000 | $115,000 | $175,000 |
| 2022 | $4,089 | $218,300 | $88,400 | $129,900 |
| 2021 | $4,089 | $218,300 | $88,400 | $129,900 |
| 2020 | $4,089 | $218,300 | $88,400 | $129,900 |
| 2019 | $4,089 | $218,300 | $88,400 | $129,900 |
| 2018 | $3,630 | $174,500 | $82,300 | $92,200 |
| 2017 | $3,532 | $174,500 | $82,300 | $92,200 |
| 2016 | $3,532 | $174,500 | $82,300 | $92,200 |
| 2015 | $3,299 | $159,000 | $72,000 | $87,000 |
| 2014 | $3,190 | $159,000 | $72,000 | $87,000 |
| 2013 | $3,147 | $159,000 | $72,000 | $87,000 |
Source: Public Records
Map
Nearby Homes
- 190 Chapmans Ave
- 15 Burt St
- 333 Greenwood Ave
- 63 Pond View Dr
- 6 Lillian Ct
- 37 George Arden Ave
- 7 Rutherford Ct Unit 12
- 794 Williamsburg Cir
- 846 Halifax Dr
- 765 Williamsburg Cir
- 856 Halifax Dr
- 69 Haverhill Ave
- 299 George Arden Ave
- 224 Palace Ave
- 139 Lancaster Ave
- 28 Chatworth Ave
- 170 Calderwood Dr
- 84 Spruce St
- 995 Williamsburg Cir
- 142 Edaville Ct
- 142 Potters Ave
- 154 Potters Ave
- 136 Potters Ave
- 141 Natick Ave
- 153 Natick Ave
- 135 Natick Ave
- 128 Potters Ave
- 129 Natick Ave
- 131 Trinity St
- 115 Trinity St
- 123 Natick Ave
- 122 Potters Ave
- 101 Trinity St
- 171 Natick Ave
- 142 Natick Ave
- 154 Natick Ave
- 130 Natick Ave
- 180 Potters Ave
- 111 Natick Ave
- 112 Potters Ave