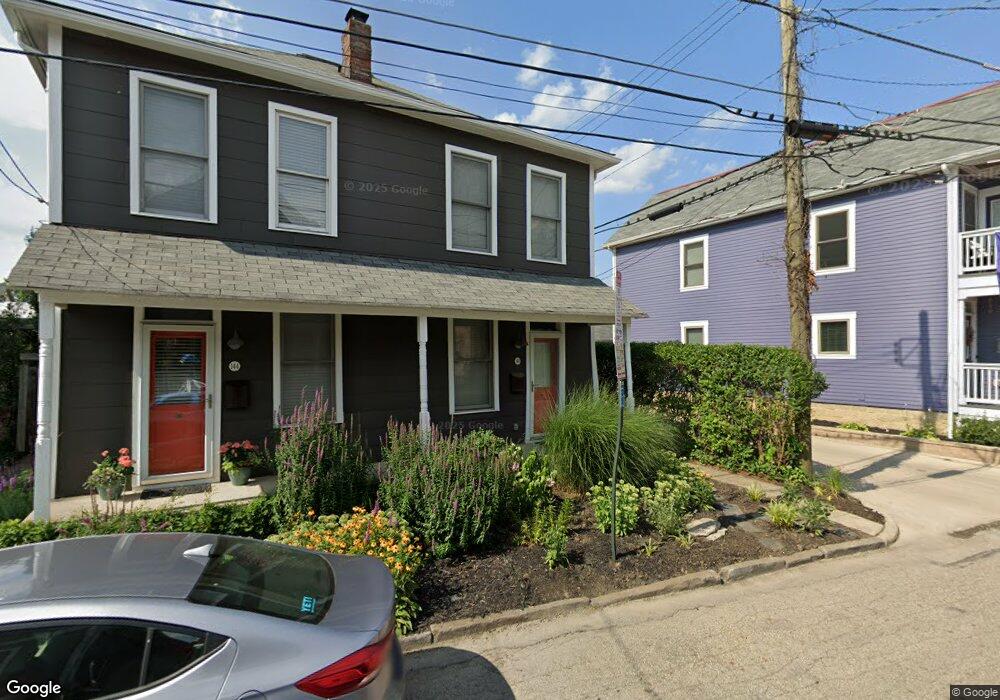
146 Punta Alley Columbus, OH 43201
Italian Village NeighborhoodEstimated Value: $214,000 - $222,000
2
Beds
1
Bath
840
Sq Ft
$262/Sq Ft
Est. Value
About This Home
This home is located at 146 Punta Alley, Columbus, OH 43201 and is currently estimated at $219,954, approximately $261 per square foot. 146 Punta Alley is a home located in Franklin County with nearby schools including Weinland Park Elementary School, Dominion Middle School, and Whetstone High School.
Ownership History
Date
Name
Owned For
Owner Type
Purchase Details
Closed on
Nov 1, 2024
Sold by
Collins Erin M
Bought by
Hissem Jeffrey A
Current Estimated Value
Home Financials for this Owner
Home Financials are based on the most recent Mortgage that was taken out on this home.
Original Mortgage
$168,000
Outstanding Balance
$166,585
Interest Rate
7.5%
Mortgage Type
Credit Line Revolving
Estimated Equity
$53,369
Purchase Details
Closed on
Sep 21, 2011
Sold by
Lee You Hau
Bought by
Collins Erin M
Home Financials for this Owner
Home Financials are based on the most recent Mortgage that was taken out on this home.
Original Mortgage
$118,750
Interest Rate
4.32%
Mortgage Type
New Conventional
Purchase Details
Closed on
Apr 17, 2006
Sold by
Hissem Jeffrey A
Bought by
Lee You Hau
Home Financials for this Owner
Home Financials are based on the most recent Mortgage that was taken out on this home.
Original Mortgage
$128,700
Interest Rate
6.42%
Mortgage Type
Fannie Mae Freddie Mac
Create a Home Valuation Report for This Property
The Home Valuation Report is an in-depth analysis detailing your home's value as well as a comparison with similar homes in the area
Home Values in the Area
Average Home Value in this Area
Purchase History
| Date | Buyer | Sale Price | Title Company |
|---|---|---|---|
| Hissem Jeffrey A | $210,000 | Amerititle | |
| Collins Erin M | $125,000 | Amerititle | |
| Lee You Hau | $165,000 | Amerititle |
Source: Public Records
Mortgage History
| Date | Status | Borrower | Loan Amount |
|---|---|---|---|
| Open | Hissem Jeffrey A | $168,000 | |
| Previous Owner | Collins Erin M | $118,750 | |
| Previous Owner | Lee You Hau | $128,700 |
Source: Public Records
Tax History Compared to Growth
Tax History
| Year | Tax Paid | Tax Assessment Tax Assessment Total Assessment is a certain percentage of the fair market value that is determined by local assessors to be the total taxable value of land and additions on the property. | Land | Improvement |
|---|---|---|---|---|
| 2024 | $2,619 | $58,360 | $12,260 | $46,100 |
| 2023 | $2,586 | $58,360 | $12,260 | $46,100 |
| 2022 | $2,691 | $51,880 | $11,560 | $40,320 |
| 2021 | $2,696 | $51,880 | $11,560 | $40,320 |
| 2020 | $2,699 | $51,880 | $11,560 | $40,320 |
| 2019 | $2,861 | $47,160 | $10,510 | $36,650 |
| 2018 | $2,920 | $47,160 | $10,510 | $36,650 |
| 2017 | $2,859 | $47,160 | $10,510 | $36,650 |
| 2016 | $3,288 | $49,640 | $8,830 | $40,810 |
| 2015 | $2,985 | $49,640 | $8,830 | $40,810 |
| 2014 | $2,992 | $49,640 | $8,830 | $40,810 |
| 2013 | $332 | $11,165 | $595 | $10,570 |
Source: Public Records
Map
Nearby Homes
- 0 Summit St Unit 225030000
- 904 Hamlet St
- 69-71 E 1st Ave
- 1105 Say Ave
- 181 E 4th Ave
- 975 N 6th St
- 1136 Summit St
- 100 E 4th Ave
- 17 W 3rd Ave Unit 212
- 17 W 3rd Ave Unit 213
- 835 Summit St
- 47 E 4th Ave
- 1149 Summit St
- 1151 Summit St
- 1152 Summit St
- 236 E 4th Ave
- 825 N 4th St Unit 402
- 825 N 4th St Unit 406
- 11 W 1st Ave Unit B
- 249 E Greenwood Ave
- 146 Punta Alley Unit 146 PUNTA ALLEY
- 144 Punta Alley
- 150 Punta Alley
- 136 Punta Alley
- 141 Punta Alley
- 154 Punta Alley
- 141 E 3rd Ave
- 140 Punta Alley
- 138 Punta Alley Unit 138
- 135 Punta Alley
- 143 E 3rd Ave Unit 145
- 143 E 3rd Ave
- 1000 Summit St
- 153 Punta Alley
- 151 E 3rd Ave
- 1004 Summit St
- 994 Summit St
- 155 E 3rd Ave
- 149 Punta Alley Unit 153
- 1008 Summit St Unit 10