NOT LISTED FOR SALE

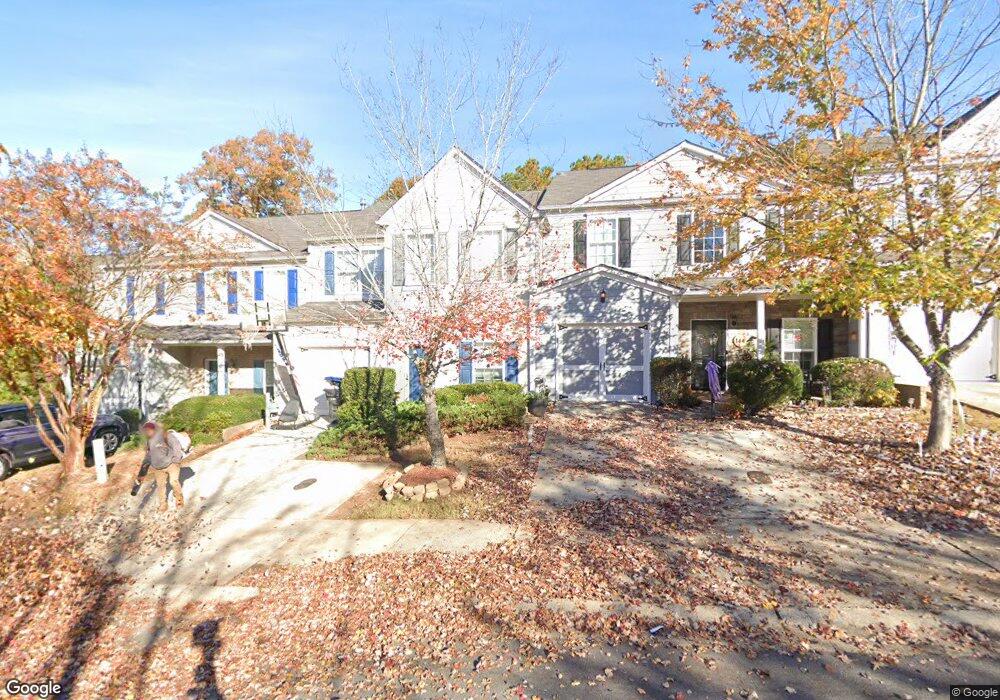
146 Spring Way Square Canton, GA 30114

Estimated Value: $307,000 - $323,000

3 Beds
3 Baths
1,694 Sq Ft
$185/Sq Ft Est. Value

About This Home

This home is located at 146 Spring Way Square, Canton, GA 30114 and is currently estimated at $313,694, approximately $185 per square foot. 146 Spring Way Square is a home located in Cherokee County with nearby schools including Liberty Elementary School, Freedom Middle School, and Cherokee High School.

Ownership History

Date Name Owned For Owner Type

Purchase Details

Closed on
Feb 6, 2014
Sold by
May Linsey
Bought by
Torres Gilberto Danilo
Current Estimated Value
$313,694

Home Financials for this Owner

Home Financials are based on the most recent Mortgage that was taken out on this home.
Original Mortgage
$116,844
Interest Rate
4.62%
Mortgage Type
FHA

Purchase Details

Closed on
Dec 30, 2011
Sold by
Federal Home Loan Mortgage Corporation
Bought by
May Linsey

Purchase Details

Closed on
Oct 4, 2011
Sold by
Us Bank National Associati
Bought by
Federal Home Loan Mortgage Corporation

Purchase Details

Closed on
Sep 19, 2006
Sold by
Homeland Legacy Builders
Bought by
Doerflein Joan S and Davies Jean

Home Financials for this Owner

Home Financials are based on the most recent Mortgage that was taken out on this home.
Original Mortgage
$128,000
Interest Rate
6.48%
Source: Public Records

Range of Values:

Collateral Analytics

Collateral Analytics Collateral Analytics AVMs (Automated Valuation Model) employ a number of statistical approaches combined with neighborhood-specific comparable selection guarantees the most up-to-date and precise valuations.

Not Available

Collateral Analytics does not have data for the current month. Please view the chart for historical values.

ICE

ICE Mortgage Technology ICE Mortgage Technology’s AVM (Automated Valuation Model) is a state-of-the-art online residential property valuation tool that provides a quick and accurate estimate of the value of almost any home in the U.S.

Not Available

ICE Mortgage Technology does not have data for the current month. Please view the chart for historical values.

First American

First American First American Data & Analytics’ next-generation AVM combines unrivaled data assets with a blended ensemble of valuation models to produce highly accurate, reliable valuations you can trust.

Not Available

First American does not have data for the current month. Please view the chart for historical values.

Quantarium

Quantarium Quantarium’s valuation service, repeatedly proven the industry’s most accurate and comprehensive, is supercharged with a self-learning and auto-tuning AI engine that continually becomes smarter and more accurate as it processes daily inputs from the industry’s leading RE data lake.

Not Available

Quantarium does not have data for the current month. Please view the chart for historical values.

Average Value
Not Available
List Price
Sold Price
Create a Home Valuation Report for This Property
The Home Valuation Report is an in-depth analysis detailing your home's value as well as a comparison with similar homes in the area

Home Values in the Area

Source: Public Records

Average Home Value in this Area


Source: Public Records

Purchase History

Date Buyer Sale Price Title Company
Torres Gilberto Danilo $119,000 --
May Linsey -- --
Federal Home Loan Mortgage Corporation -- --
Us Bank National Association $52,500 --
Doerflein Joan S $150,600 --
Source: Public Records

Mortgage History

Date Status Borrower Loan Amount
Open Torres Gilberto Danilo $114,977
Closed Torres Gilberto Danilo $116,844
Previous Owner Davies Jean M $23,700
Previous Owner Davies Jean M $14,000
Previous Owner Doerflein Joan S $128,000
Source: Public Records

Tax History Compared to Growth

Source: Public Records

Tax History

Year Tax Paid Tax Assessment Tax Assessment Total Assessment is a certain percentage of the fair market value that is determined by local assessors to be the total taxable value of land and additions on the property. Land Improvement
2024 $3,297 $110,528 $24,000 $86,528
2023 $3,372 $111,032 $24,000 $87,032
2022 $2,851 $93,040 $20,000 $73,040
2021 $1,808 $72,040 $17,200 $54,840
2020 $2,344 $69,960 $15,200 $54,760
2019 $1,617 $64,320 $13,600 $50,720
2018 $2,006 $58,760 $12,000 $46,760
2017 $1,802 $133,800 $10,400 $43,120
2016 $1,344 $130,500 $10,400 $41,800
2015 $1,202 $115,700 $9,200 $37,080
2014 $1,128 $108,400 $9,200 $34,160
Source: Public Records

Map