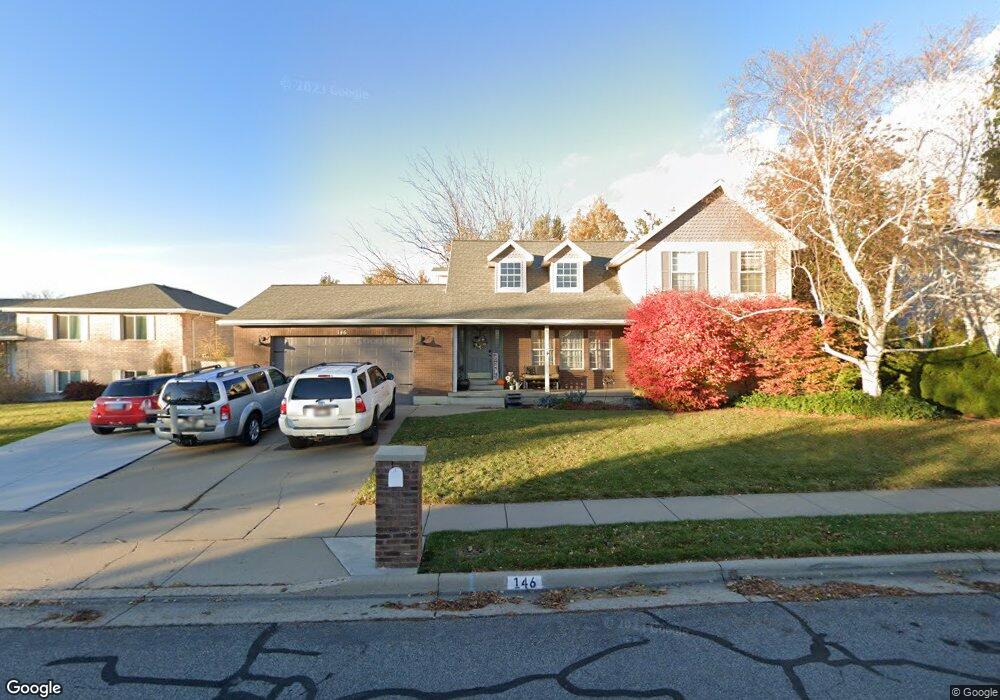
146 W 550 S Centerville, UT 84014
Estimated Value: $557,000 - $724,000
5
Beds
3
Baths
2,018
Sq Ft
$329/Sq Ft
Est. Value
About This Home
This home is located at 146 W 550 S, Centerville, UT 84014 and is currently estimated at $664,158, approximately $329 per square foot. 146 W 550 S is a home located in Davis County with nearby schools including J A Taylor Elementary School, Centerville Jr High, and Viewmont High School.
Ownership History
Date
Name
Owned For
Owner Type
Purchase Details
Closed on
Mar 15, 2021
Sold by
Newey Martyn and Newey Julie A
Bought by
Newey Marty and Newey Julie A
Current Estimated Value
Home Financials for this Owner
Home Financials are based on the most recent Mortgage that was taken out on this home.
Original Mortgage
$432,000
Outstanding Balance
$386,377
Interest Rate
2.7%
Mortgage Type
New Conventional
Estimated Equity
$277,782
Purchase Details
Closed on
Jul 18, 2012
Sold by
Newey Martyn
Bought by
Newey Martyn and Newey Julie A
Purchase Details
Closed on
Mar 16, 2012
Sold by
Newey Marty and Newey Julie A
Bought by
Newey Martyn
Home Financials for this Owner
Home Financials are based on the most recent Mortgage that was taken out on this home.
Original Mortgage
$224,000
Interest Rate
3.84%
Mortgage Type
New Conventional
Purchase Details
Closed on
Dec 31, 1998
Sold by
Moultrie C Tim and Moultrie Kathy R
Bought by
Newey Marty and Newey Julie A
Create a Home Valuation Report for This Property
The Home Valuation Report is an in-depth analysis detailing your home's value as well as a comparison with similar homes in the area
Home Values in the Area
Average Home Value in this Area
Purchase History
| Date | Buyer | Sale Price | Title Company |
|---|---|---|---|
| Newey Marty | -- | Pioneer Title Ins Ag | |
| Newey Martyn | -- | Pioneer Title Ins Agen | |
| Newey Martyn | -- | Pioneeer Title Ins Age | |
| Newey Marty | -- | Associated Title Company |
Source: Public Records
Mortgage History
| Date | Status | Borrower | Loan Amount |
|---|---|---|---|
| Open | Newey Marty | $432,000 | |
| Closed | Newey Martyn | $224,000 |
Source: Public Records
Tax History Compared to Growth
Tax History
| Year | Tax Paid | Tax Assessment Tax Assessment Total Assessment is a certain percentage of the fair market value that is determined by local assessors to be the total taxable value of land and additions on the property. | Land | Improvement |
|---|---|---|---|---|
| 2025 | $2,616 | $343,750 | $169,147 | $174,603 |
| 2024 | $2,616 | $342,100 | $153,446 | $188,654 |
| 2023 | $3,459 | $608,000 | $249,845 | $358,155 |
| 2022 | $3,591 | $347,600 | $126,535 | $221,065 |
| 2021 | $757 | $461,000 | $195,195 | $265,805 |
| 2020 | $2,753 | $415,000 | $189,627 | $225,373 |
| 2019 | $2,812 | $414,000 | $186,672 | $227,328 |
| 2018 | $2,674 | $389,000 | $173,029 | $215,971 |
| 2016 | $2,310 | $186,780 | $56,736 | $130,044 |
| 2015 | $2,309 | $176,110 | $56,736 | $119,374 |
| 2014 | $2,008 | $156,681 | $56,736 | $99,945 |
| 2013 | -- | $171,964 | $49,376 | $122,588 |
Source: Public Records
Map
Nearby Homes
- 353 Florentine Ln
- 63 E 820 S
- 420 Rawlins Cir
- 204 Lyman Ln
- 234 Leah Cir
- 156 E 735 S Unit 24
- 239 Lyman Ln
- 967 S Courtyard Ln
- 117 Cara Vella Ln
- 1552 N 200 W
- 88 W 50 S Unit Q12
- 88 W 50 S Unit A4
- 88 W 50 S Unit F9
- 548 S 675 W
- 324 S 600 W
- 2 S 285 W
- 1410 N 200 W
- 1503 N 300 W
- 147 N 360 W Unit 21
- 266 E Center St