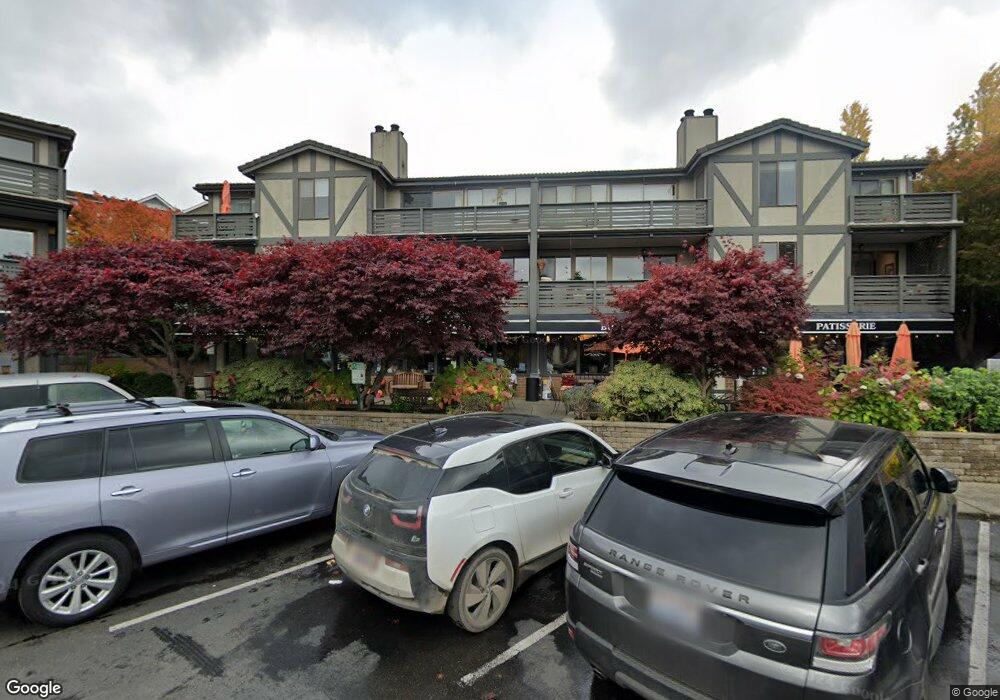
146 Winslow Way W Bainbridge Island, WA 98110
Estimated Value: $489,123 - $551,000
--
Bed
--
Bath
1,078
Sq Ft
$489/Sq Ft
Est. Value
About This Home
This home is located at 146 Winslow Way W, Bainbridge Island, WA 98110 and is currently estimated at $526,708, approximately $488 per square foot. 146 Winslow Way W is a home located in Kitsap County with nearby schools including Bainbridge High School, Madrona School, and St. Cecilia Catholic School.
Ownership History
Date
Name
Owned For
Owner Type
Purchase Details
Closed on
Jan 3, 2020
Sold by
Bsp Associates Llc
Bought by
Solak Adem and Solak Birgul
Current Estimated Value
Purchase Details
Closed on
Jan 1, 2020
Sold by
Bsp Associates Llc
Bought by
Solak Adem and Solak Birgul
Purchase Details
Closed on
Sep 26, 2013
Sold by
Bsp Associates Llc
Bought by
Solak Adem and Solak Birgul
Home Financials for this Owner
Home Financials are based on the most recent Mortgage that was taken out on this home.
Original Mortgage
$228,500
Interest Rate
4.46%
Mortgage Type
Seller Take Back
Purchase Details
Closed on
Mar 12, 2012
Sold by
Auxier Pamela M
Bought by
Bsp Associates Llc
Purchase Details
Closed on
Oct 4, 2004
Sold by
Oakley George
Bought by
Bsp Associates Llc
Home Financials for this Owner
Home Financials are based on the most recent Mortgage that was taken out on this home.
Original Mortgage
$110,500
Interest Rate
5.82%
Mortgage Type
Seller Take Back
Create a Home Valuation Report for This Property
The Home Valuation Report is an in-depth analysis detailing your home's value as well as a comparison with similar homes in the area
Home Values in the Area
Average Home Value in this Area
Purchase History
| Date | Buyer | Sale Price | Title Company |
|---|---|---|---|
| Solak Adem | -- | None Available | |
| Solak Adem | -- | None Available | |
| Solak Adem | $320,000 | Pacific Northwest Title | |
| Bsp Associates Llc | -- | None Available | |
| Bsp Associates Llc | $300,000 | Pacific Nw Title |
Source: Public Records
Mortgage History
| Date | Status | Borrower | Loan Amount |
|---|---|---|---|
| Previous Owner | Solak Adem | $228,500 | |
| Previous Owner | Bsp Associates Llc | $110,500 |
Source: Public Records
Tax History Compared to Growth
Tax History
| Year | Tax Paid | Tax Assessment Tax Assessment Total Assessment is a certain percentage of the fair market value that is determined by local assessors to be the total taxable value of land and additions on the property. | Land | Improvement |
|---|---|---|---|---|
| 2026 | $3,769 | $516,800 | -- | $516,800 |
| 2025 | $3,769 | $447,310 | -- | $447,310 |
| 2024 | $3,619 | $449,320 | -- | $449,320 |
| 2023 | $3,175 | $374,470 | $0 | $374,470 |
| 2022 | $3,504 | $356,600 | $0 | $356,600 |
| 2021 | $4,042 | $396,220 | $0 | $396,220 |
| 2020 | $3,586 | $344,530 | $0 | $344,530 |
| 2019 | $3,514 | $344,530 | $0 | $344,530 |
| 2018 | $3,237 | $282,370 | $0 | $282,370 |
| 2017 | $3,041 | $282,370 | $0 | $282,370 |
| 2016 | $3,040 | $269,480 | $0 | $269,480 |
| 2015 | $2,980 | $269,480 | $0 | $269,480 |
| 2014 | -- | $266,270 | $55,040 | $211,230 |
| 2013 | -- | $266,270 | $73,010 | $193,260 |
Source: Public Records
Map
Nearby Homes
- 115 Hall Brothers Loop NW Unit 203
- 3 Bedroom Plan at Trillium, Grow Community | Bainbridge Island - The Trillium
- 2 Bedroom Plan at Trillium, Grow Community | Bainbridge Island - The Trillium
- 204 Shepard Way NW
- 208 Shepard Way NW
- 224 Canopy Path NW
- 228 Canopy Path NW
- 141 Parfitt Way SW Unit M-10
- 141 Parfitt Way SW Unit M-40
- 465 Winslow Way E Unit 108
- 645 Madison Ave N
- 346 Wyatt Way NE Unit 10
- 511 Groos Ln NE
- 360 Knechtel Way NE Unit 201
- 737 Village Cir NW
- 752 NE Vineyard Ln Unit L205
- 610 NE Vineyard Ln Unit A104
- 744 Hanami Ln NE
- 502 Cave Ave NE
- 428 Harborview Dr SE Unit 112
- 146 Winslow Way W Unit G
- 148 Winslow Way W
- 148 Winslow Way W Unit F
- 148 Winslow Way W Unit 20
- 155 Madison Ave N Unit 17
- 160 Winslow Way W Unit E
- 160 Winslow Way W
- 164 Winslow Way W
- 124 Winslow Way W
- 124 Winslow Way W Unit L
- 121 Madison Ave N
- 125 Madison Ave N Unit 31
- 120 Winslow Way W Unit M
- 171 Madison Ave N Unit 3
- 117 Madison Ave N
- 162 Winslow Way W
- 113 Madison Ave N
- 113 Madison Ave N Unit 24
- 175 Madison Ave N
- 107 Madison Ave N Unit 34