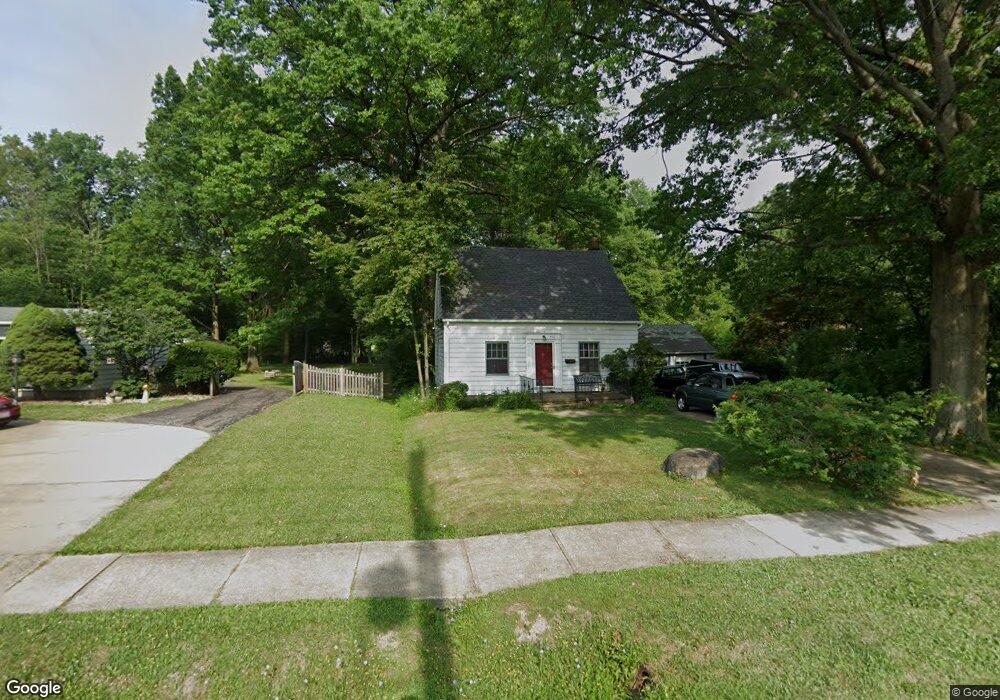
1460 Canterbury Rd Westlake, OH 44145
Estimated Value: $201,000 - $267,000
3
Beds
1
Bath
1,008
Sq Ft
$231/Sq Ft
Est. Value
About This Home
This home is located at 1460 Canterbury Rd, Westlake, OH 44145 and is currently estimated at $232,645, approximately $230 per square foot. 1460 Canterbury Rd is a home located in Cuyahoga County with nearby schools including Westlake Elementary School, Dover Intermediate School, and Lee Burneson Middle School.
Ownership History
Date
Name
Owned For
Owner Type
Purchase Details
Closed on
Oct 7, 2021
Sold by
Hahn Christopher L and Hahn Gayle S
Bought by
Hahn Gayle S
Current Estimated Value
Purchase Details
Closed on
Jul 26, 2017
Sold by
Hahn Christopher L
Bought by
Hahn Gayle S
Purchase Details
Closed on
May 13, 1996
Sold by
Flatley Patrick J
Bought by
Hahn Christopher L
Home Financials for this Owner
Home Financials are based on the most recent Mortgage that was taken out on this home.
Original Mortgage
$80,000
Interest Rate
7.78%
Mortgage Type
New Conventional
Purchase Details
Closed on
May 27, 1993
Bought by
Flatley Patrick J
Purchase Details
Closed on
Jan 26, 1982
Sold by
Collins David R and Collins Lucille E
Bought by
Collins David R - Trs
Purchase Details
Closed on
Jan 1, 1975
Bought by
Collins David R and Collins Lucille E
Create a Home Valuation Report for This Property
The Home Valuation Report is an in-depth analysis detailing your home's value as well as a comparison with similar homes in the area
Home Values in the Area
Average Home Value in this Area
Purchase History
| Date | Buyer | Sale Price | Title Company |
|---|---|---|---|
| Hahn Gayle S | -- | None Available | |
| Hahn Gayle S | -- | None Available | |
| Hahn Christopher L | $100,000 | -- | |
| Flatley Patrick J | $92,000 | -- | |
| Collins David R - Trs | -- | -- | |
| Collins David R | -- | -- |
Source: Public Records
Mortgage History
| Date | Status | Borrower | Loan Amount |
|---|---|---|---|
| Previous Owner | Hahn Christopher L | $80,000 |
Source: Public Records
Tax History Compared to Growth
Tax History
| Year | Tax Paid | Tax Assessment Tax Assessment Total Assessment is a certain percentage of the fair market value that is determined by local assessors to be the total taxable value of land and additions on the property. | Land | Improvement |
|---|---|---|---|---|
| 2024 | $3,526 | $71,470 | $20,405 | $51,065 |
| 2023 | $3,902 | $67,030 | $19,290 | $47,740 |
| 2022 | $3,833 | $67,025 | $19,285 | $47,740 |
| 2021 | $3,369 | $67,030 | $19,290 | $47,740 |
| 2020 | $2,852 | $53,620 | $15,440 | $38,190 |
| 2019 | $2,777 | $153,200 | $44,100 | $109,100 |
| 2018 | $3,121 | $53,620 | $15,440 | $38,190 |
| 2017 | $3,024 | $48,310 | $11,870 | $36,440 |
| 2016 | $3,102 | $48,310 | $11,870 | $36,440 |
| 2015 | $2,764 | $48,310 | $11,870 | $36,440 |
| 2014 | $2,764 | $43,510 | $10,680 | $32,830 |
Source: Public Records
Map
Nearby Homes
- 1359 Marview Dr
- 1432 Stone Ct
- 1326 Marview Dr
- 1504 Beethoven Dr
- 1455 Mozart Dr
- 1579 Queens Ct
- 26553 Hilliard Blvd
- 1528 Dover Center Rd
- 25530 Hilliard Blvd
- 1016 Dover Center Rd
- 0 Hilliard Blvd Unit 5128276
- 1930 King James Pkwy Unit 205
- 1720 Westhill Blvd
- 2353 W Hedgewood Dr
- 2021 King James Pkwy Unit 222
- 551 Elmwood Rd
- 26927 E Oviatt Rd
- 1931 King James Pkwy Unit 427
- 27923 Hilliard Blvd
- 1851 King James Pkwy Unit 114
- 1480 Canterbury Rd
- 1438 Canterbury Rd
- 1494 Canterbury Rd
- 1455 Canterbury Rd
- 1467 Canterbury Rd
- 1398 Canterbury Rd
- 1461 Canterbury Rd
- 1500 Canterbury Rd
- 1435 Canterbury Rd
- 1497 Canterbury Rd
- 1489 Canterbury Rd
- 1380 Canterbury Rd
- 1405 Canterbury Rd
- 1520 Canterbury Rd
- 1379 Canterbury Rd
- 1515 Canterbury Rd
- 1530 Canterbury Rd
- 1370 Canterbury Rd
- 1527 Canterbury Rd
- 1395 Marview Dr