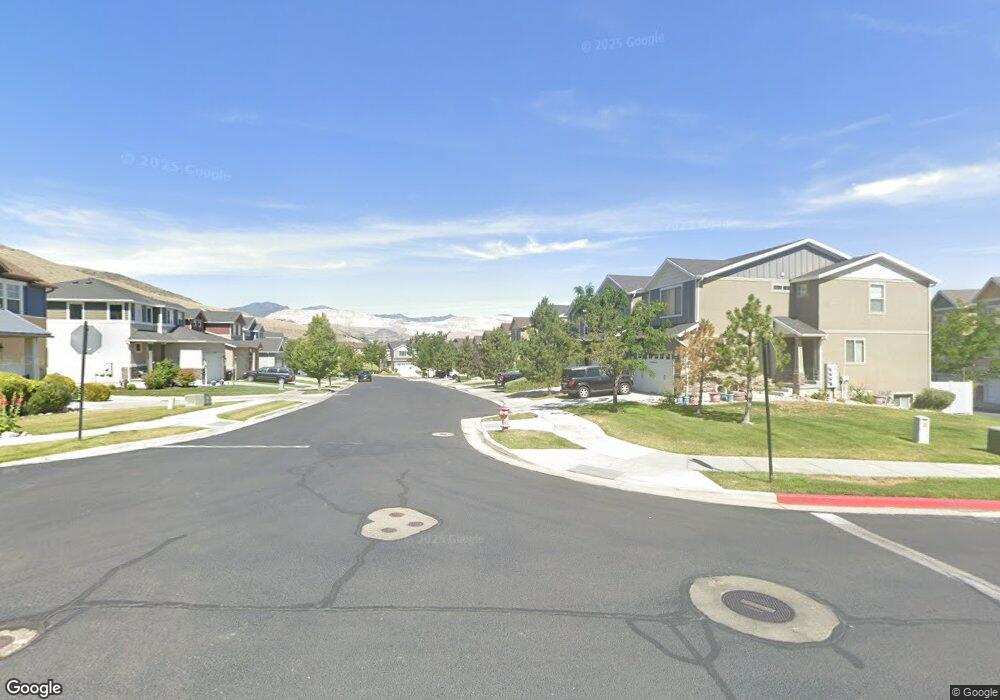
14607 S Pebble Rose Dr Herriman, UT 84096
Estimated Value: $416,000 - $430,000
3
Beds
3
Baths
2,315
Sq Ft
$183/Sq Ft
Est. Value
About This Home
This home is located at 14607 S Pebble Rose Dr, Herriman, UT 84096 and is currently estimated at $423,774, approximately $183 per square foot. 14607 S Pebble Rose Dr is a home located in Salt Lake County with nearby schools including Blackridge School, South Hills Middle School, and Mountain Ridge High School.
Ownership History
Date
Name
Owned For
Owner Type
Purchase Details
Closed on
Mar 22, 2018
Sold by
Bowen Lee
Bought by
Trilee Properties Llc
Current Estimated Value
Home Financials for this Owner
Home Financials are based on the most recent Mortgage that was taken out on this home.
Original Mortgage
$202,500
Outstanding Balance
$173,279
Interest Rate
4.32%
Mortgage Type
New Conventional
Estimated Equity
$250,495
Purchase Details
Closed on
Mar 20, 2018
Sold by
Higbee Ernest B and Higbee Carrie M
Bought by
Bowen Lee
Home Financials for this Owner
Home Financials are based on the most recent Mortgage that was taken out on this home.
Original Mortgage
$202,500
Outstanding Balance
$173,279
Interest Rate
4.32%
Mortgage Type
New Conventional
Estimated Equity
$250,495
Purchase Details
Closed on
Sep 20, 2007
Sold by
Rosecrest Village Llc
Bought by
Higbee Ernest D and Higbee Carrie M
Home Financials for this Owner
Home Financials are based on the most recent Mortgage that was taken out on this home.
Original Mortgage
$185,548
Interest Rate
6.57%
Mortgage Type
Purchase Money Mortgage
Create a Home Valuation Report for This Property
The Home Valuation Report is an in-depth analysis detailing your home's value as well as a comparison with similar homes in the area
Home Values in the Area
Average Home Value in this Area
Purchase History
| Date | Buyer | Sale Price | Title Company |
|---|---|---|---|
| Trilee Properties Llc | -- | Accommodation | |
| Bowen Lee | -- | Old Republic Title Draperer | |
| Higbee Ernest D | -- | Metro National Title |
Source: Public Records
Mortgage History
| Date | Status | Borrower | Loan Amount |
|---|---|---|---|
| Open | Bowen Lee | $202,500 | |
| Previous Owner | Higbee Ernest D | $185,548 |
Source: Public Records
Tax History Compared to Growth
Tax History
| Year | Tax Paid | Tax Assessment Tax Assessment Total Assessment is a certain percentage of the fair market value that is determined by local assessors to be the total taxable value of land and additions on the property. | Land | Improvement |
|---|---|---|---|---|
| 2025 | $2,440 | $410,800 | $75,100 | $335,700 |
| 2024 | $2,440 | $400,200 | $73,100 | $327,100 |
| 2023 | $2,523 | $391,600 | $71,700 | $319,900 |
| 2022 | $2,582 | $399,600 | $70,300 | $329,300 |
| 2021 | $2,174 | $295,400 | $58,500 | $236,900 |
| 2020 | $2,068 | $264,800 | $53,300 | $211,500 |
| 2019 | $2,010 | $253,100 | $42,200 | $210,900 |
| 2018 | $1,804 | $223,700 | $41,100 | $182,600 |
| 2017 | $1,698 | $208,100 | $41,100 | $167,000 |
| 2016 | $1,739 | $204,500 | $41,100 | $163,400 |
| 2015 | $1,670 | $190,300 | $67,200 | $123,100 |
| 2014 | $1,597 | $178,300 | $64,000 | $114,300 |
Source: Public Records
Map
Nearby Homes
- 5102 W Valmont Way
- 5098 W Fortrose Dr
- 5063 W Arete Way
- 5178 Hedgerose Dr
- 5194 W Hedgerose Dr
- 14514 S Windom Rd
- 14481 S Stone Stream St
- 5144 Emmeline Dr
- 14483 S Ryegate Dr
- 5198 W Courtly Ln
- 14649 S Quiet Glen Dr
- 14762 S Desert Sage Dr
- 14642 S Edgemere Dr
- 5232 W Courtly Ln
- 5078 W Woodsmere Ln
- 5206 W Windom Rd
- 14662 S Birken St
- 14757 S Quiet Glen Dr
- 14347 S Mount Ogden Peak Dr
- 14879 S Headrose Dr
- 14607 Pebble Rose Dr
- 14603 S Pebble Rose Dr
- 14603 Pebble Rose Dr
- 14601 S Pebble Rose Dr Unit 8-3
- 14601 S Pebble Rose Dr
- 14601 Pebble Rose Dr
- 14599 Pebble Rose Dr
- 14599 S Pebble Rose Dr
- 14591 Elysian Way
- 14597 Pebble Rose Dr
- 14597 S Pebble Rose Dr
- 14589 Elysian Way
- 14589 S Elysian Way
- 5132 W Fortrose Dr
- 5134 Fortrose Dr
- 5132 Fortrose Dr
- 5128 Fortrose Dr
- 5128 W Fortrose Dr
- 5136 W Fortrose Dr Unit 9-4
- 5136 W Fortrose Dr