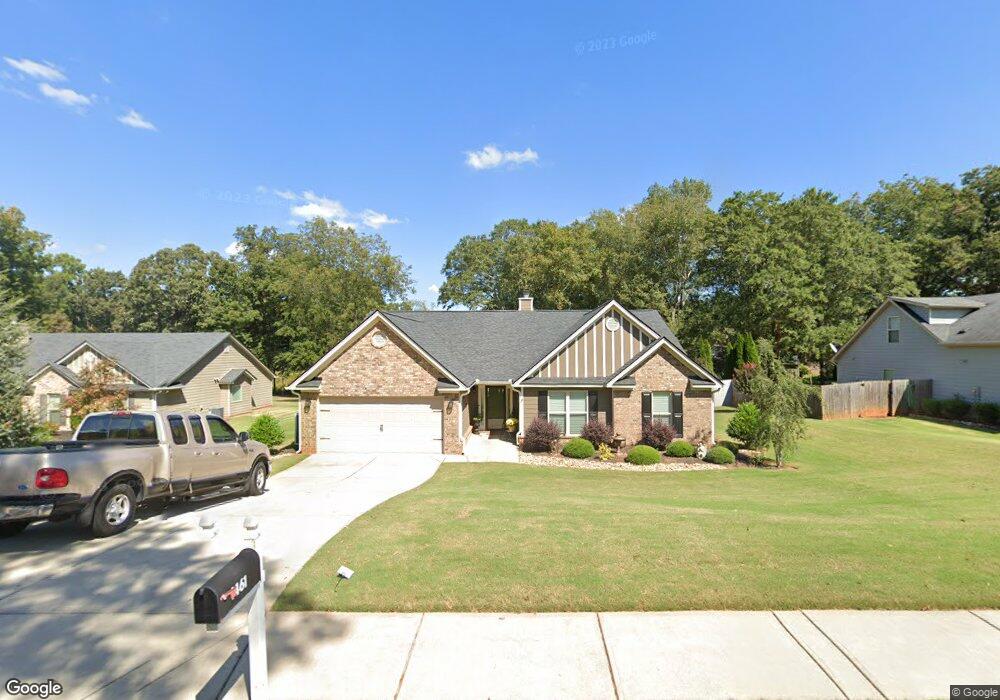
1461 Fieldstone Ct Unit 12 Winder, GA 30680
Estimated Value: $377,720 - $425,000
4
Beds
2
Baths
2,250
Sq Ft
$180/Sq Ft
Est. Value
About This Home
This home is located at 1461 Fieldstone Ct Unit 12, Winder, GA 30680 and is currently estimated at $405,180, approximately $180 per square foot. 1461 Fieldstone Ct Unit 12 is a home located in Barrow County with nearby schools including Bramlett Elementary School, Russell Middle School, and Winder-Barrow High School.
Ownership History
Date
Name
Owned For
Owner Type
Purchase Details
Closed on
Jan 16, 2015
Sold by
Southfork Homes Llc
Bought by
Velez Reynaldo and Velez Margarita
Current Estimated Value
Home Financials for this Owner
Home Financials are based on the most recent Mortgage that was taken out on this home.
Original Mortgage
$140,313
Outstanding Balance
$107,592
Interest Rate
3.87%
Mortgage Type
FHA
Estimated Equity
$297,588
Purchase Details
Closed on
Apr 15, 2014
Sold by
Golden Royal Properties Ll
Bought by
Southfork Homes Llc
Purchase Details
Closed on
Feb 6, 2012
Sold by
Scbt Na
Bought by
Golden Royal Properties Llc
Purchase Details
Closed on
Sep 1, 2009
Sold by
Preston Properties Inc
Bought by
Community Bank & Trust
Purchase Details
Closed on
Aug 25, 2006
Sold by
Holliday Cook and Holliday Sand
Bought by
Preston Properties Inc
Create a Home Valuation Report for This Property
The Home Valuation Report is an in-depth analysis detailing your home's value as well as a comparison with similar homes in the area
Home Values in the Area
Average Home Value in this Area
Purchase History
| Date | Buyer | Sale Price | Title Company |
|---|---|---|---|
| Velez Reynaldo | $167,900 | -- | |
| Southfork Homes Llc | $217,500 | -- | |
| Golden Royal Properties Llc | $117,000 | -- | |
| Community Bank & Trust | -- | -- | |
| Preston Properties Inc | $842,100 | -- |
Source: Public Records
Mortgage History
| Date | Status | Borrower | Loan Amount |
|---|---|---|---|
| Open | Velez Reynaldo | $140,313 |
Source: Public Records
Tax History Compared to Growth
Tax History
| Year | Tax Paid | Tax Assessment Tax Assessment Total Assessment is a certain percentage of the fair market value that is determined by local assessors to be the total taxable value of land and additions on the property. | Land | Improvement |
|---|---|---|---|---|
| 2024 | $3,003 | $121,704 | $16,800 | $104,904 |
| 2023 | $2,594 | $122,104 | $16,800 | $105,304 |
| 2022 | $2,485 | $87,290 | $16,800 | $70,490 |
| 2021 | $2,621 | $87,290 | $16,800 | $70,490 |
| 2020 | $2,622 | $87,290 | $16,800 | $70,490 |
| 2019 | $2,667 | $87,290 | $16,800 | $70,490 |
| 2018 | $2,373 | $78,528 | $16,800 | $61,728 |
| 2017 | $1,860 | $63,887 | $16,800 | $47,087 |
| 2016 | $1,905 | $64,364 | $16,800 | $47,564 |
| 2015 | $2,030 | $64,364 | $16,800 | $47,564 |
| 2014 | $223 | $7,098 | $7,098 | $0 |
| 2013 | -- | $7,098 | $7,098 | $0 |
Source: Public Records
Map
Nearby Homes
- 1020 Easy St
- 1224 Treemont Trace
- 787 Murphy Rd
- 1202 Treemont Trace
- 852 Georgetown Dr
- 817 Kenwood Ln
- 681 County Line Auburn Rd
- 1022 Cyperts Trail
- 1406 Lull Water Ct
- 127 Deer Canyon Dr
- 112 Rocking Wood Dr
- 1136 Lexington Ridge Rd
- 83 Deer Canyon Dr
- 156 Rocky Ridge Way
- 150 Rocky Ridge Way
- 24 Rocking Wood Dr
- 99 Mcmillian Ct
- 1461 Fieldstone Ct
- 1463 Fieldstone Ct Unit 13
- 1463 Fieldstone Ct
- 1459 Fieldstone Ct Unit 11
- 1459 Fieldstone Ct
- 1308 Fieldstone Dr Unit 8
- 1308 Fieldstone Dr
- 1465 Fieldstone Ct Unit 14
- 1465 Fieldstone Ct
- 1465 Fieldstone Ct
- 1306 Fieldstone Dr Unit 9
- 1306 Fieldstone Dr
- 1462 Fieldstone Ct Unit 17
- 1462 Fieldstone Ct
- 1460 Fieldstone Ct
- 1451 Fieldstone Ct
- 1464 Fieldstone Ct Unit 16
- 1458 Fieldstone Ct Unit 19
- 1458 Fieldstone Ct
- 1466 Fieldstone Ct Unit 15