Estimated Value: $490,000 - $557,000
3
Beds
2
Baths
1,414
Sq Ft
$361/Sq Ft
Est. Value
About This Home
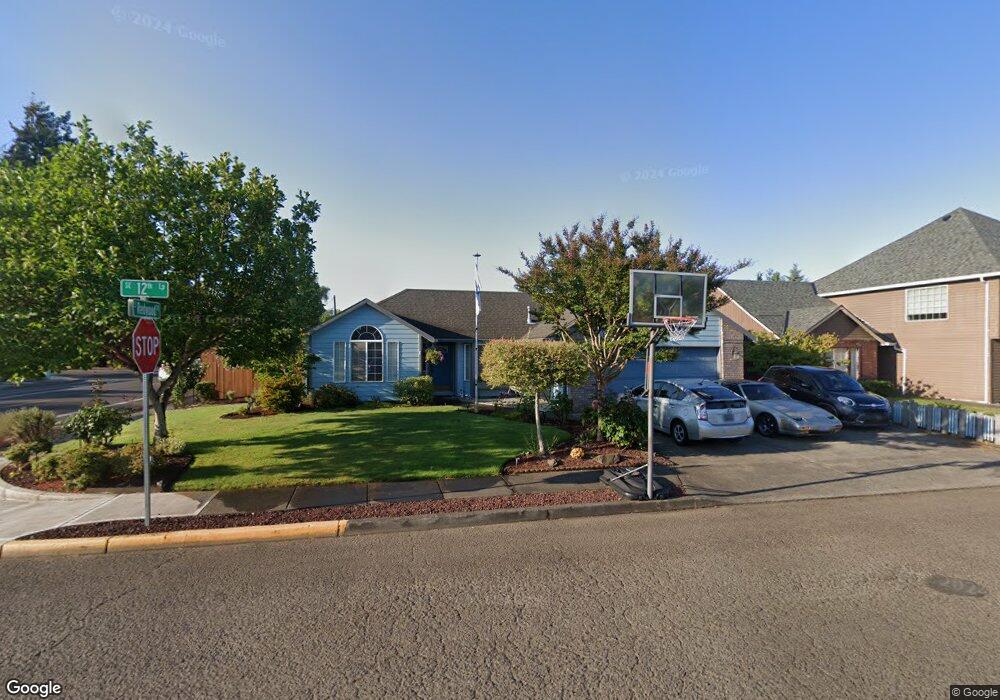
This home is located at 1461 SE 12th Loop Unit 1, Canby, OR 97013 and is currently estimated at $510,879, approximately $361 per square foot. 1461 SE 12th Loop Unit 1 is a home located in Clackamas County with nearby schools including Cecile Trost Elementary School, Carus School, and Baker Prairie Middle School.
Ownership History
Date
Name
Owned For
Owner Type
Purchase Details
Closed on
Apr 22, 2022
Sold by
Sanford William W
Bought by
Rossman Roger
Current Estimated Value
Home Financials for this Owner
Home Financials are based on the most recent Mortgage that was taken out on this home.
Original Mortgage
$391,200
Outstanding Balance
$363,224
Interest Rate
3.85%
Mortgage Type
New Conventional
Estimated Equity
$147,655
Purchase Details
Closed on
Apr 20, 2022
Sold by
Roger Rossman
Bought by
Rossman Roger and Norrisromine Mario J
Home Financials for this Owner
Home Financials are based on the most recent Mortgage that was taken out on this home.
Original Mortgage
$391,200
Outstanding Balance
$363,224
Interest Rate
3.85%
Mortgage Type
New Conventional
Estimated Equity
$147,655
Purchase Details
Closed on
Jun 19, 2014
Sold by
Lindborg Andrew E and Lindborg Shelley
Bought by
Sanford William and Sanford Cynkthia
Home Financials for this Owner
Home Financials are based on the most recent Mortgage that was taken out on this home.
Original Mortgage
$238,500
Interest Rate
4.17%
Mortgage Type
New Conventional
Purchase Details
Closed on
Feb 4, 2011
Sold by
Lindborg Andrew E
Bought by
Lindborg Andrew E and Lindborg Shelley
Purchase Details
Closed on
Sep 30, 2010
Sold by
Lindborg Shelley
Bought by
Lindborg Andrew E
Home Financials for this Owner
Home Financials are based on the most recent Mortgage that was taken out on this home.
Original Mortgage
$271,591
Interest Rate
4.35%
Mortgage Type
VA
Purchase Details
Closed on
Aug 26, 2009
Sold by
Lindborg Andrew E
Bought by
Lindborg Andrew E and Lindborg Shelley
Purchase Details
Closed on
Jun 10, 2009
Sold by
Lindborg Shelley
Bought by
Lindborg Andrew E
Home Financials for this Owner
Home Financials are based on the most recent Mortgage that was taken out on this home.
Original Mortgage
$265,131
Interest Rate
4.76%
Mortgage Type
VA
Purchase Details
Closed on
Jun 22, 2006
Sold by
Reed Scott and Reed Lisa
Bought by
Lindborg Andrew E and Lindborg Shelley
Home Financials for this Owner
Home Financials are based on the most recent Mortgage that was taken out on this home.
Original Mortgage
$262,525
Interest Rate
6.55%
Mortgage Type
VA
Purchase Details
Closed on
Jun 14, 2006
Sold by
Reed Scott and Reed Lisa
Bought by
Reed Scott E and Reed Lisa M
Home Financials for this Owner
Home Financials are based on the most recent Mortgage that was taken out on this home.
Original Mortgage
$262,525
Interest Rate
6.55%
Mortgage Type
VA
Purchase Details
Closed on
May 17, 1999
Sold by
Burklund Charles M and Burklund Kimberly M
Bought by
Reed Scott and Reed Lisa
Home Financials for this Owner
Home Financials are based on the most recent Mortgage that was taken out on this home.
Original Mortgage
$102,000
Interest Rate
6.92%
Purchase Details
Closed on
May 22, 1995
Sold by
Borg Construction Inc
Bought by
Burklund Charles M and Burklund Kimberly M
Home Financials for this Owner
Home Financials are based on the most recent Mortgage that was taken out on this home.
Original Mortgage
$113,867
Interest Rate
8.51%
Create a Home Valuation Report for This Property
The Home Valuation Report is an in-depth analysis detailing your home's value as well as a comparison with similar homes in the area
Home Values in the Area
Average Home Value in this Area
Purchase History
| Date | Buyer | Sale Price | Title Company |
|---|---|---|---|
| Rossman Roger | $489,000 | New Title Company Name | |
| Rossman Roger | -- | New Title Company Name | |
| Sanford William | $279,900 | Chicago Title Company | |
| Lindborg Andrew E | -- | None Available | |
| Lindborg Andrew E | -- | First Amer Title Ins Co Or | |
| Lindborg Andrew E | -- | None Available | |
| Lindborg Andrew E | -- | First American | |
| Lindborg Andrew E | $257,000 | Chicago Title Insurance Co | |
| Reed Scott E | -- | Ticor Title Insurance Compan | |
| Reed Scott | $159,900 | First American Title Co | |
| Burklund Charles M | $119,860 | First American Title Ins Co |
Source: Public Records
Mortgage History
| Date | Status | Borrower | Loan Amount |
|---|---|---|---|
| Open | Rossman Roger | $391,200 | |
| Previous Owner | Sanford William | $238,500 | |
| Previous Owner | Lindborg Andrew E | $271,591 | |
| Previous Owner | Lindborg Andrew E | $265,131 | |
| Previous Owner | Lindborg Andrew E | $262,525 | |
| Previous Owner | Reed Scott E | $140,700 | |
| Previous Owner | Reed Scott | $102,000 | |
| Previous Owner | Burklund Charles M | $113,867 |
Source: Public Records
Tax History
| Year | Tax Paid | Tax Assessment Tax Assessment Total Assessment is a certain percentage of the fair market value that is determined by local assessors to be the total taxable value of land and additions on the property. | Land | Improvement |
|---|---|---|---|---|
| 2025 | $4,840 | $273,214 | -- | -- |
| 2024 | $4,705 | $265,257 | -- | -- |
| 2023 | $4,705 | $257,532 | -- | -- |
| 2022 | $4,327 | $250,032 | $0 | $0 |
| 2021 | $4,167 | $242,750 | $0 | $0 |
| 2020 | $4,093 | $235,680 | $0 | $0 |
| 2019 | $3,897 | $228,816 | $0 | $0 |
| 2018 | $3,810 | $222,151 | $0 | $0 |
| 2017 | $3,714 | $215,681 | $0 | $0 |
| 2016 | $3,590 | $209,399 | $0 | $0 |
| 2015 | $3,467 | $203,300 | $0 | $0 |
| 2014 | $3,367 | $197,379 | $0 | $0 |
Source: Public Records
Map
Nearby Homes
- 1804 S Locust St
- 1316 SE 16th Ave
- 1650 S Redwood St
- 1380 SE 9th Ave
- 1827 S Pepperwood St
- 1821 S Pepperwood St
- 1825 S Pepperwood St
- 1823 S Pepperwood St
- 1460 SE 9th Ave
- 1305 SE 17th Ave
- 1231 SE 18th Place
- 312 SE 13th Place
- 1407 SE 7th Ave
- 1053 S Vine St
- 215 SE 16th Ave
- 213 SE 16th Ave
- 211 SE 16th Ave
- 2180 SE 11th Place
- 1172 SE 18th Ave
- 331 SE 9th Ave
- 1461 SE 12th Loop
- 1439 SE 12th Loop
- 1385 SE 12th Loop
- 1284 S Redwood St
- 1440 SE 12th Loop
- 1256 S Redwood St
- 1416 SE 12th Loop
- 1232 S Redwood St
- 1377 SE 12th Loop
- 1285 S Sycamore St
- 1320 SE 13th Place
- 1218 S Redwood St
- 1211 S Redwood St
- 1423 SE 12th Loop
- 1257 S Sycamore St
- 1374 SE 12th Loop
- 1485 SE 13th Ave
- 1363 SE 12th Loop
- 1310 SE 13th Place
- 1509 SE 12th Ave
Your Personal Tour Guide
Ask me questions while you tour the home.