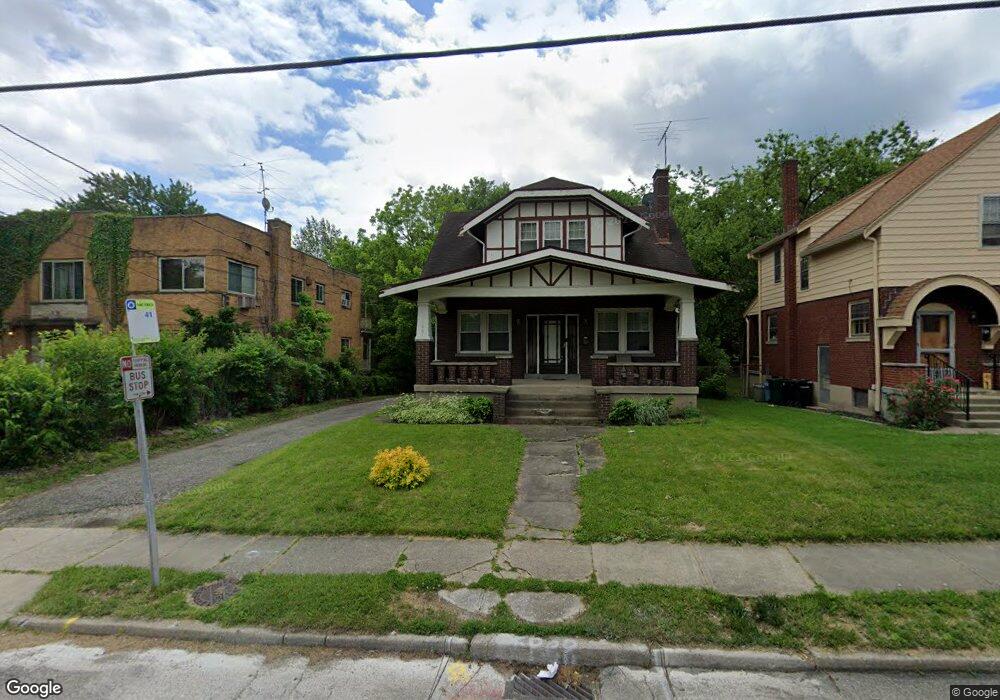
1461 W North Bend Rd Cincinnati, OH 45224
College Hill NeighborhoodEstimated Value: $249,000 - $267,000
2
Beds
2
Baths
1,751
Sq Ft
$148/Sq Ft
Est. Value
About This Home
This home is located at 1461 W North Bend Rd, Cincinnati, OH 45224 and is currently estimated at $259,028, approximately $147 per square foot. 1461 W North Bend Rd is a home located in Hamilton County with nearby schools including Pleasant Hill Elementary School, Robert A. Taft Information Technology High School, and Western Hills High School.
Ownership History
Date
Name
Owned For
Owner Type
Purchase Details
Closed on
Jun 8, 2007
Sold by
Abn Amro Mortgage Group Inc
Bought by
Samuels Jermaine
Current Estimated Value
Home Financials for this Owner
Home Financials are based on the most recent Mortgage that was taken out on this home.
Original Mortgage
$65,289
Outstanding Balance
$40,445
Interest Rate
6.42%
Mortgage Type
Purchase Money Mortgage
Estimated Equity
$218,583
Purchase Details
Closed on
Aug 2, 2006
Sold by
Horton Vanessa
Bought by
Abn Amro Mortgage Group Inc
Purchase Details
Closed on
Aug 12, 1998
Sold by
Hud
Bought by
Horton Vanessa
Home Financials for this Owner
Home Financials are based on the most recent Mortgage that was taken out on this home.
Original Mortgage
$53,600
Interest Rate
6.59%
Purchase Details
Closed on
May 7, 1998
Sold by
Leis Simon L and Wiles Irwin
Bought by
Hud
Create a Home Valuation Report for This Property
The Home Valuation Report is an in-depth analysis detailing your home's value as well as a comparison with similar homes in the area
Home Values in the Area
Average Home Value in this Area
Purchase History
| Date | Buyer | Sale Price | Title Company |
|---|---|---|---|
| Samuels Jermaine | -- | Attorney | |
| Abn Amro Mortgage Group Inc | $60,000 | None Available | |
| Horton Vanessa | -- | Titlequest Agency Inc | |
| Hud | $65,000 | -- |
Source: Public Records
Mortgage History
| Date | Status | Borrower | Loan Amount |
|---|---|---|---|
| Open | Samuels Jermaine | $65,289 | |
| Previous Owner | Horton Vanessa | $53,600 | |
| Closed | Horton Vanessa | $13,400 |
Source: Public Records
Tax History Compared to Growth
Tax History
| Year | Tax Paid | Tax Assessment Tax Assessment Total Assessment is a certain percentage of the fair market value that is determined by local assessors to be the total taxable value of land and additions on the property. | Land | Improvement |
|---|---|---|---|---|
| 2024 | $3,848 | $64,082 | $13,045 | $51,037 |
| 2023 | $3,930 | $64,082 | $13,045 | $51,037 |
| 2022 | $2,274 | $33,146 | $10,623 | $22,523 |
| 2021 | $2,189 | $33,146 | $10,623 | $22,523 |
| 2020 | $2,248 | $33,146 | $10,623 | $22,523 |
| 2019 | $2,159 | $29,075 | $9,317 | $19,758 |
| 2018 | $2,162 | $29,075 | $9,317 | $19,758 |
| 2017 | $2,056 | $29,075 | $9,317 | $19,758 |
| 2016 | $2,048 | $28,581 | $9,940 | $18,641 |
| 2015 | $1,846 | $28,581 | $9,940 | $18,641 |
| 2014 | $1,859 | $28,581 | $9,940 | $18,641 |
| 2013 | $1,949 | $29,467 | $10,248 | $19,219 |
Source: Public Records
Map
Nearby Homes
- 1428 Ambrose Ave
- 1437 Ambrose Ave
- 6123 Faircrest Ct
- 1541 Wittekind Terrace
- 1205 Wionna Ave
- 5923 Lantana Ave
- 1522 Wittekind Terrace
- 1406 Wittekind Terrace
- 1634 W North Bend Rd
- 1636 W North Bend Rd
- 1417 Cedar Ave
- 6242 Station Court Dr
- 1605 N Dixon Cir
- 1549 Teakwood Ave
- 6340 Hamilton Ave
- 5773 Lantana Ave
- 1453 Larrywood Ln
- 1137 Homeside Ave
- 1147 Homeside Ave
- 5908 Cary Ave
- 1501 W North Bend Rd
- 1457 W North Bend Rd
- 1453 W North Bend Rd
- 1449 W North Bend Rd
- 1445 W North Bend Rd
- 1504 W North Bend Rd
- 1441 W North Bend Rd
- 1506 Elkton Place
- 1510 Elkton Place
- 1519 W North Bend Rd Unit 2
- 1519 W North Bend Rd Unit 3
- 1519 W North Bend Rd
- 1437 W North Bend Rd
- 1514 Elkton Place
- 1440 W North Bend Rd
- 1502 Elkton Place
- 1518 W North Bend Rd
- 1460 Elkton Place
- 1523 W North Bend Rd
- 1456 Elkton Place