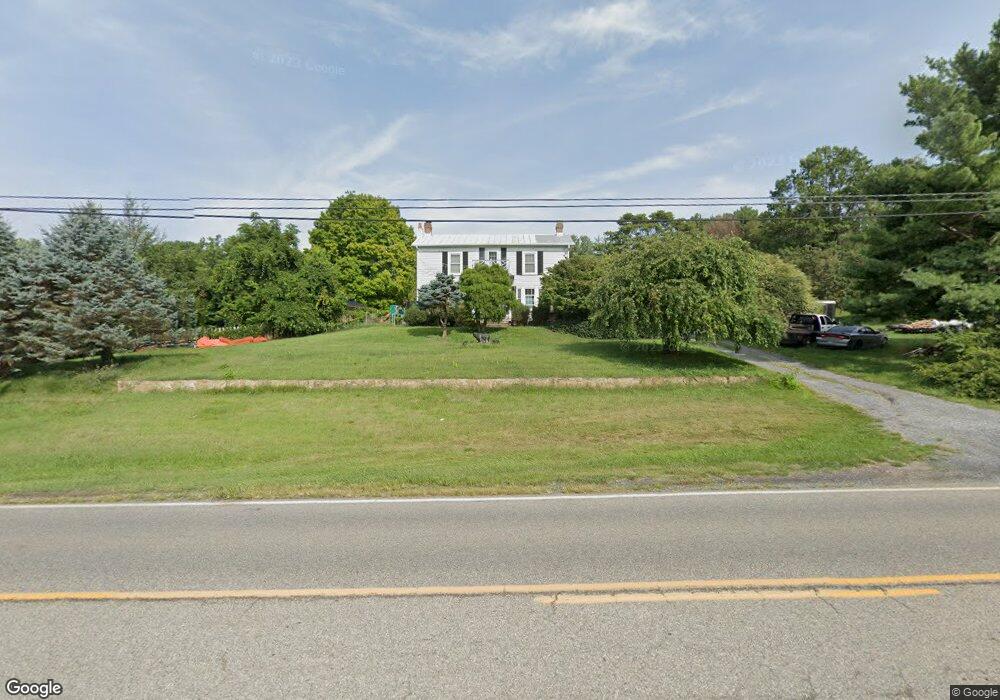
1462 Lee Hwy Fort Defiance, VA 24437
Estimated Value: $391,000 - $541,000
4
Beds
3
Baths
2,246
Sq Ft
$209/Sq Ft
Est. Value
About This Home
This home is located at 1462 Lee Hwy, Fort Defiance, VA 24437 and is currently estimated at $468,883, approximately $208 per square foot. 1462 Lee Hwy is a home located in Augusta County with nearby schools including Verona Elementary School, Edward G. Clymore Elementary School, and S. Gordon Stewart Middle School.
Ownership History
Date
Name
Owned For
Owner Type
Purchase Details
Closed on
Jan 10, 2018
Sold by
Blevins Zachary J and Blevins Stacey Y
Bought by
Breeden Lisa L
Current Estimated Value
Purchase Details
Closed on
Nov 1, 2017
Sold by
White Bonnie Z
Bought by
White Mary E and Goble Christopher L
Purchase Details
Closed on
Apr 25, 2017
Sold by
Clifton Gayle Z and Zimbro John Taylor
Bought by
White Bonnie Z
Purchase Details
Closed on
Sep 11, 2012
Sold by
Hanna Robert and Hanna Stephanie L
Bought by
Blevins Zachary J and Blevins Stacey Y
Home Financials for this Owner
Home Financials are based on the most recent Mortgage that was taken out on this home.
Original Mortgage
$235,520
Interest Rate
3.62%
Mortgage Type
VA
Create a Home Valuation Report for This Property
The Home Valuation Report is an in-depth analysis detailing your home's value as well as a comparison with similar homes in the area
Home Values in the Area
Average Home Value in this Area
Purchase History
| Date | Buyer | Sale Price | Title Company |
|---|---|---|---|
| Breeden Lisa L | $1,500 | -- | |
| White Mary E | -- | None Available | |
| White Bonnie Z | -- | None Available | |
| Blevins Zachary J | $230,000 | Court Square Title Agency |
Source: Public Records
Mortgage History
| Date | Status | Borrower | Loan Amount |
|---|---|---|---|
| Previous Owner | Blevins Zachary J | $235,520 |
Source: Public Records
Tax History Compared to Growth
Tax History
| Year | Tax Paid | Tax Assessment Tax Assessment Total Assessment is a certain percentage of the fair market value that is determined by local assessors to be the total taxable value of land and additions on the property. | Land | Improvement |
|---|---|---|---|---|
| 2025 | $1,784 | $343,060 | $56,700 | $286,360 |
| 2024 | $1,784 | $343,060 | $56,700 | $286,360 |
| 2023 | $1,571 | $249,300 | $56,200 | $193,100 |
| 2022 | $1,571 | $249,300 | $56,200 | $193,100 |
| 2021 | $1,571 | $249,300 | $56,200 | $193,100 |
| 2020 | $1,571 | $249,300 | $56,200 | $193,100 |
| 2019 | $1,571 | $249,300 | $56,200 | $193,100 |
| 2018 | $1,458 | $231,439 | $56,200 | $175,239 |
| 2017 | $1,342 | $231,439 | $56,200 | $175,239 |
| 2016 | $1,342 | $231,439 | $56,200 | $175,239 |
| 2015 | $1,311 | $231,439 | $56,200 | $175,239 |
| 2014 | $1,311 | $231,439 | $56,200 | $175,239 |
| 2013 | $1,311 | $273,100 | $61,200 | $211,900 |
Source: Public Records
Map
Nearby Homes
- 73 Bailey Rd
- 0 Dam Town Rd Unit 667981
- 175 Bailey Rd
- 145 Fort Defiance Rd
- 81 Cedar Creek Ln
- 188 River Ridge Rd
- TBD Earhart Ln
- TBD Augusta St
- TBD Bald Rock Rd
- TBD Rifes Ford Rd
- 0 Mill Race Rd Unit 646067
- 330 Bald Rock Rd
- 79 River Ridge Rd
- 248 Skyview Cir
- Lot 37a Rife's Ford Rd
- Lot 75b Rife's Ford Rd
- Lot 37a1 Rife's Ford Rd
- Lot 37j Rife's Ford Rd
- Lot 10g Rife's Ford Rd
- Lot 37k Rife's Ford Rd
- 1400 Lee Hwy
- 65 Captain Hizer Ln
- 67 Captain Hizer Ln
- 36 Captain Hizer Ln
- 1.96 Captain Hizer Ln
- 2.02 Captain Hizer Ln
- 1.97 Captain Hizer Ln
- 23 acres Captain Hizer Ln
- 34 Captain Hizer Ln
- 1472 Lee Hwy
- 75 Captain Hizer Ln
- 22 Captain Hizer Ln
- 27 acres Captain Hizer Ln
- 14 Toll Gate Rd
- 14 Captain Hizer Ln
- 84 Captain Hizer Ln
- 83 Captain Hizer Ln
- 93 Captain Hizer Ln
- 6 Captain Hizer Ln
- 6 Captain Hizer Ln