Estimated Value: $465,363 - $513,000
4
Beds
2
Baths
2,196
Sq Ft
$220/Sq Ft
Est. Value
About This Home
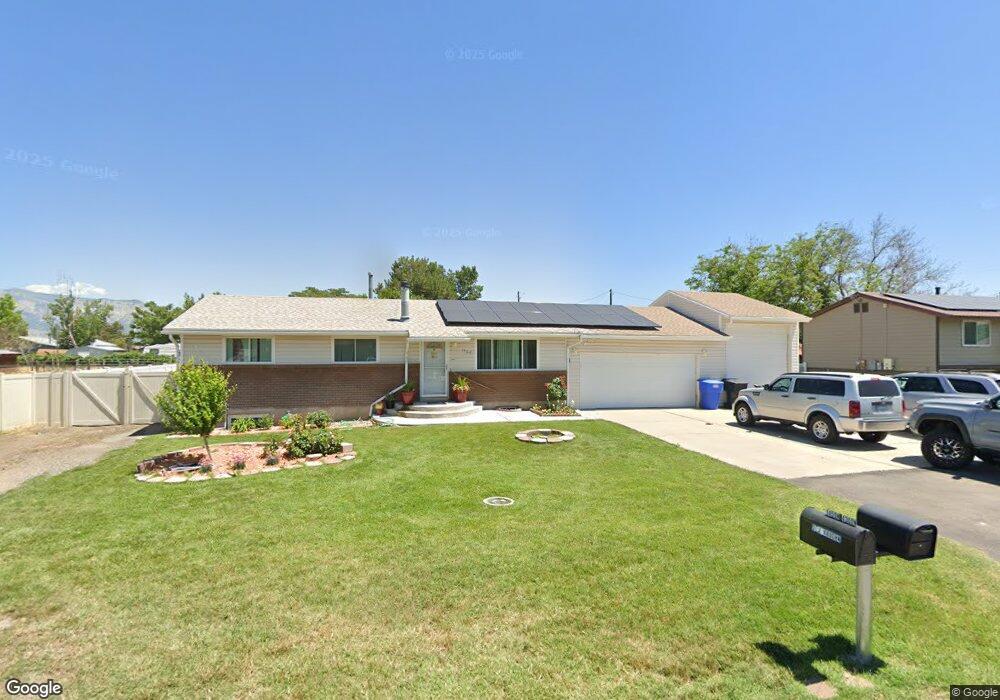
This home is located at 1462 N 4300 W, Ogden, UT 84404 and is currently estimated at $483,341, approximately $220 per square foot. 1462 N 4300 W is a home located in Weber County with nearby schools including Plain City School, Wahlquist Junior High School, and Fremont High School.
Ownership History
Date
Name
Owned For
Owner Type
Purchase Details
Closed on
Oct 11, 2021
Sold by
Farny Luke
Bought by
Farny Luke Patrick
Current Estimated Value
Home Financials for this Owner
Home Financials are based on the most recent Mortgage that was taken out on this home.
Original Mortgage
$330,000
Outstanding Balance
$300,929
Interest Rate
2.8%
Mortgage Type
New Conventional
Estimated Equity
$182,412
Purchase Details
Closed on
Aug 25, 2021
Sold by
Dnp General Llc
Bought by
Farny Luke
Home Financials for this Owner
Home Financials are based on the most recent Mortgage that was taken out on this home.
Original Mortgage
$330,000
Outstanding Balance
$300,929
Interest Rate
2.8%
Mortgage Type
New Conventional
Estimated Equity
$182,412
Purchase Details
Closed on
Jul 2, 2021
Sold by
Palmer Jay W and Palmer Sandra M
Bought by
Dnp General Llc
Home Financials for this Owner
Home Financials are based on the most recent Mortgage that was taken out on this home.
Original Mortgage
$377,483
Interest Rate
2.8%
Mortgage Type
Stand Alone Refi Refinance Of Original Loan
Create a Home Valuation Report for This Property
The Home Valuation Report is an in-depth analysis detailing your home's value as well as a comparison with similar homes in the area
Home Values in the Area
Average Home Value in this Area
Purchase History
| Date | Buyer | Sale Price | Title Company |
|---|---|---|---|
| Farny Luke Patrick | -- | 1St Liberty Title Llc | |
| Farny Luke | -- | Accommodation | |
| Dnp General Llc | -- | Title One | |
| Farny Luke | -- | Accommodation |
Source: Public Records
Mortgage History
| Date | Status | Borrower | Loan Amount |
|---|---|---|---|
| Open | Farny Luke Patrick | $330,000 | |
| Closed | Farny Luke | $377,483 | |
| Previous Owner | Dnp General Llc | $374,000 |
Source: Public Records
Tax History Compared to Growth
Tax History
| Year | Tax Paid | Tax Assessment Tax Assessment Total Assessment is a certain percentage of the fair market value that is determined by local assessors to be the total taxable value of land and additions on the property. | Land | Improvement |
|---|---|---|---|---|
| 2025 | $2,653 | $458,796 | $139,084 | $319,712 |
| 2024 | $2,515 | $248,048 | $76,496 | $171,552 |
| 2023 | $2,292 | $223,850 | $76,622 | $147,228 |
| 2022 | $2,480 | $253,000 | $76,622 | $176,378 |
| 2021 | $2,106 | $356,000 | $79,525 | $276,475 |
| 2020 | $1,912 | $294,000 | $64,637 | $229,363 |
| 2019 | $1,836 | $265,000 | $54,634 | $210,366 |
| 2018 | $1,751 | $240,000 | $54,634 | $185,366 |
| 2017 | $1,517 | $192,000 | $53,637 | $138,363 |
| 2016 | $1,433 | $98,517 | $27,388 | $71,129 |
| 2015 | $1,399 | $93,730 | $27,388 | $66,342 |
| 2014 | $1,368 | $89,778 | $27,388 | $62,390 |
Source: Public Records
Map
Nearby Homes
- 4370 W 1500 N
- 4227 W Pioneer Rd
- 1748 N 4100 St W
- 1885 N 4475 W
- 4210 W 1975 N
- 1239 N 4925 W
- 2131 N 4650 W
- 4212 W 1975 N
- 1221 N 4975 W
- 3966 W 2200 N
- 3622 W 2200 St N Unit 23
- 2416 N 4275 W
- 3594 W 2200 N Unit 3
- 2255 N 3600 St W Unit 21
- 2233 N 3600 St W Unit 22
- 2700 N 4200 W
- 155 S 4700 W
- 2793 W 2775 N
- 2797 W 2775 N Unit 129
- 2782 W 2775 N Unit 105