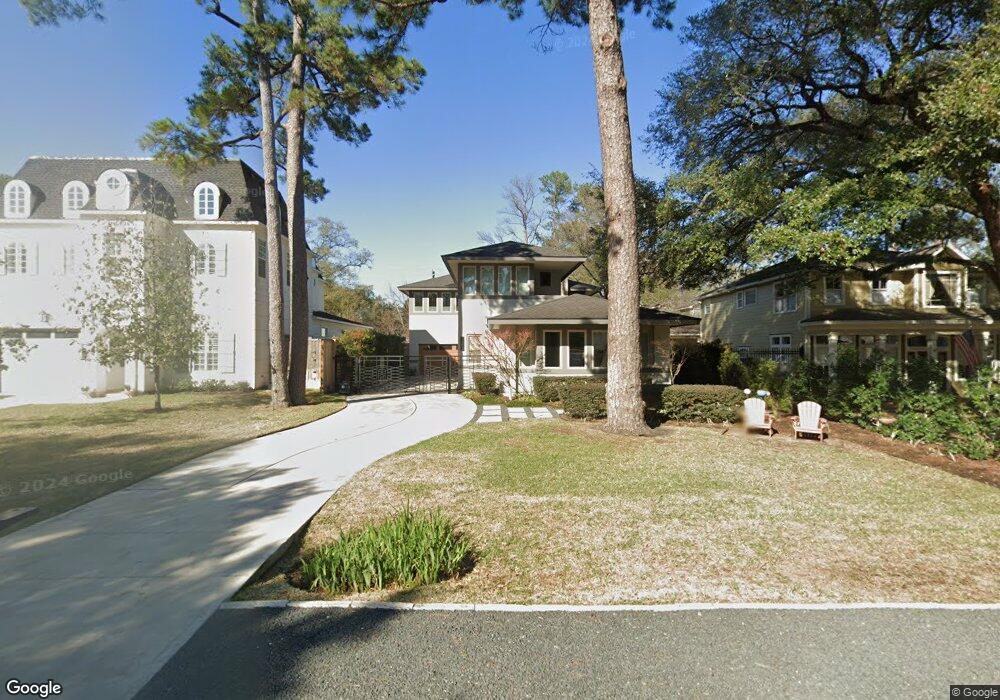
1462 Sue Barnett Dr Houston, TX 77018
Oak Forest-Garden Oaks NeighborhoodEstimated Value: $1,518,000 - $2,228,000
5
Beds
6
Baths
4,043
Sq Ft
$423/Sq Ft
Est. Value
About This Home
This home is located at 1462 Sue Barnett Dr, Houston, TX 77018 and is currently estimated at $1,711,062, approximately $423 per square foot. 1462 Sue Barnett Dr is a home located in Harris County with nearby schools including Durham Elementary School, Frank Black Middle School, and Waltrip High School.
Ownership History
Date
Name
Owned For
Owner Type
Purchase Details
Closed on
May 30, 2024
Sold by
Rodriguez Dirk and Sawyer Lea
Bought by
Leggett Cassidy Therese
Current Estimated Value
Home Financials for this Owner
Home Financials are based on the most recent Mortgage that was taken out on this home.
Original Mortgage
$1,572,500
Outstanding Balance
$1,548,179
Interest Rate
6%
Mortgage Type
New Conventional
Estimated Equity
$162,883
Purchase Details
Closed on
Jul 6, 2018
Sold by
Derrick Elbert D and Derrick Sharon M
Bought by
Rodriguez Dirk and Sawyer Lea
Purchase Details
Closed on
Jun 14, 2012
Sold by
Justin Gordon Homes Llc
Bought by
Derrick Elbert D and Derrick Sharon M
Home Financials for this Owner
Home Financials are based on the most recent Mortgage that was taken out on this home.
Original Mortgage
$702,000
Interest Rate
4.4%
Mortgage Type
Adjustable Rate Mortgage/ARM
Purchase Details
Closed on
Aug 16, 2010
Sold by
Griffin Judith G
Bought by
Justin Gordon Homes Llc
Create a Home Valuation Report for This Property
The Home Valuation Report is an in-depth analysis detailing your home's value as well as a comparison with similar homes in the area
Home Values in the Area
Average Home Value in this Area
Purchase History
| Date | Buyer | Sale Price | Title Company |
|---|---|---|---|
| Leggett Cassidy Therese | -- | Charter Title Company | |
| Rodriguez Dirk | -- | Great American Title Company | |
| Derrick Elbert D | -- | Old Republic National Title | |
| Justin Gordon Homes Llc | -- | Old Republic Title Company O |
Source: Public Records
Mortgage History
| Date | Status | Borrower | Loan Amount |
|---|---|---|---|
| Open | Leggett Cassidy Therese | $1,572,500 | |
| Previous Owner | Derrick Elbert D | $702,000 |
Source: Public Records
Tax History Compared to Growth
Tax History
| Year | Tax Paid | Tax Assessment Tax Assessment Total Assessment is a certain percentage of the fair market value that is determined by local assessors to be the total taxable value of land and additions on the property. | Land | Improvement |
|---|---|---|---|---|
| 2025 | $18,246 | $1,461,431 | $556,170 | $905,261 |
| 2024 | $18,246 | $1,491,135 | $509,823 | $981,312 |
| 2023 | $18,246 | $1,412,224 | $482,014 | $930,210 |
| 2022 | $26,512 | $1,204,048 | $482,014 | $722,034 |
| 2021 | $26,033 | $1,116,993 | $444,936 | $672,057 |
| 2020 | $26,626 | $1,099,527 | $389,319 | $710,208 |
| 2019 | $27,835 | $1,100,000 | $389,319 | $710,681 |
| 2018 | $19,228 | $960,000 | $389,319 | $570,681 |
| 2017 | $24,274 | $960,000 | $389,319 | $570,681 |
| 2016 | $25,303 | $1,000,682 | $389,319 | $611,363 |
| 2015 | $17,443 | $1,016,000 | $324,433 | $691,567 |
| 2014 | $17,443 | $971,260 | $278,085 | $693,175 |
Source: Public Records
Map
Nearby Homes
- 934 W 43rd St
- 1067 Curtin St
- 979 W 43rd St
- 991 Curtin St
- 903 W 43rd St
- 1018 Lamonte Ln
- 938 Gardenia Dr
- 830 Azalea St
- 1014 Gardenia Dr
- 1547 Sue Barnett Dr
- 1037 Cheshire Ln
- 1550 Sue Barnett Dr
- 4710 Brian Haven Dr
- 814 Azalea St
- 1029 Martin St
- 1020 W 42nd St
- 1046 Gardenia Dr
- 4762 Martin St
- 4742 Martin St
- 1062 Lamonte Ln
- 1462 Sue Barnett Dr
- 1458 Sue Barnett Dr
- 1466 Sue Barnett Dr
- 1466 Sue Barnett Dr
- 1454 Sue Barnett Dr
- 1470 Sue Barnett Dr
- 1450 Sue Barnett Dr
- 1474 Sue Barnett Dr
- 1051 Chamboard Ln
- 1459 Sue Barnett Dr
- 1059 Chamboard Ln
- 1463 Sue Barnett Dr
- 1047 Chamboard Ln
- 1455 Sue Barnett Dr
- 1446 Sue Barnett Dr
- 1467 Sue Barnett Dr
- 1478 Sue Barnett Dr
- 1451 Sue Barnett Dr
- 1063 Chamboard Ln
- 1043 Chamboard Ln