Estimated Value: $203,000 - $268,952
3
Beds
2
Baths
1,229
Sq Ft
$196/Sq Ft
Est. Value
About This Home
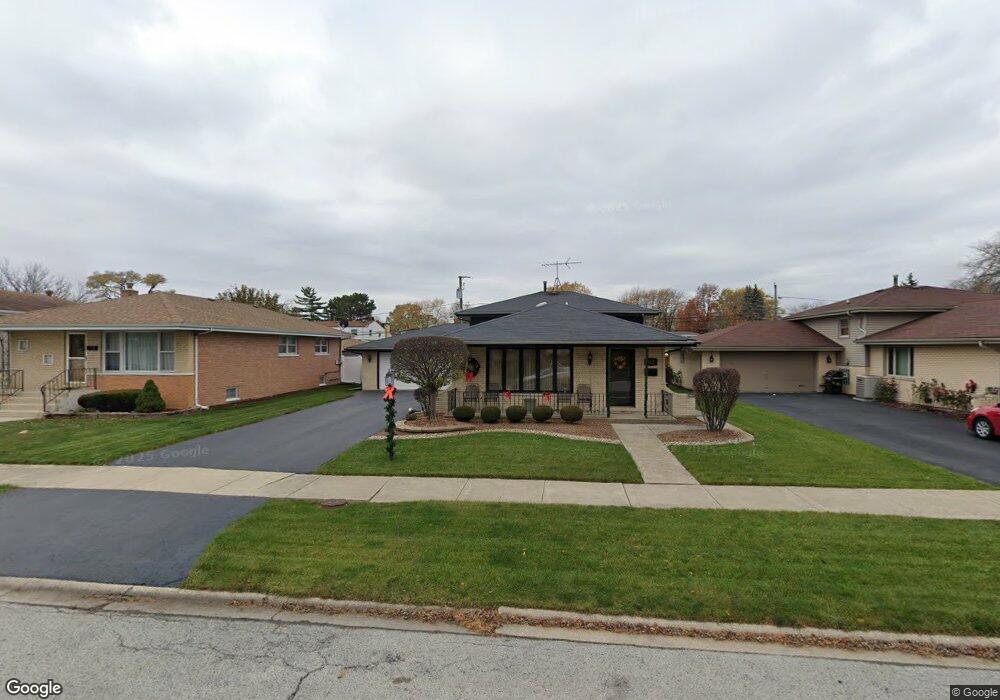
This home is located at 14620 S Sherman Ave, Posen, IL 60469 and is currently estimated at $241,488, approximately $196 per square foot. 14620 S Sherman Ave is a home located in Cook County with nearby schools including Delia M. Turner Elementary School, Posen Intermediate School, and Thomas J. Kellar Middle School.
Ownership History
Date
Name
Owned For
Owner Type
Purchase Details
Closed on
May 18, 2011
Sold by
Aylward Jane E
Bought by
Aylward Jane E and Aylward William L
Current Estimated Value
Purchase Details
Closed on
Oct 7, 1997
Sold by
Aylward William R and Aylward Jane E
Bought by
Aylward William R and Aylward Jane E
Create a Home Valuation Report for This Property
The Home Valuation Report is an in-depth analysis detailing your home's value as well as a comparison with similar homes in the area
Home Values in the Area
Average Home Value in this Area
Purchase History
| Date | Buyer | Sale Price | Title Company |
|---|---|---|---|
| Aylward Jane E | -- | None Available | |
| Aylward Jane E | -- | None Available | |
| Aylward William R | -- | -- |
Source: Public Records
Tax History Compared to Growth
Tax History
| Year | Tax Paid | Tax Assessment Tax Assessment Total Assessment is a certain percentage of the fair market value that is determined by local assessors to be the total taxable value of land and additions on the property. | Land | Improvement |
|---|---|---|---|---|
| 2024 | $3,627 | $17,000 | $2,646 | $14,354 |
| 2023 | $2,512 | $17,000 | $2,646 | $14,354 |
| 2022 | $2,512 | $12,194 | $2,268 | $9,926 |
| 2021 | $2,522 | $12,194 | $2,268 | $9,926 |
| 2020 | $2,585 | $12,194 | $2,268 | $9,926 |
| 2019 | $3,202 | $14,478 | $2,079 | $12,399 |
| 2018 | $3,147 | $14,478 | $2,079 | $12,399 |
| 2017 | $3,252 | $14,478 | $2,079 | $12,399 |
| 2016 | $3,313 | $12,809 | $1,890 | $10,919 |
| 2015 | $3,160 | $12,809 | $1,890 | $10,919 |
| 2014 | $3,159 | $12,809 | $1,890 | $10,919 |
| 2013 | $3,255 | $14,187 | $1,890 | $12,297 |
Source: Public Records
Map
Nearby Homes
- 14601 S Palmer Ave
- 14505 S Mckinley Ave
- 2606 W Walter Zimny Dr
- 14247 Davis Ct
- 14337 S Mckinley Ave
- 14715 Maplewood Ave
- 14719 Maplewood Ave
- 14801 S Harrison Ave
- 14525 Oakley St
- 14929 Cleveland Ave
- 14336 S Harrison Ave
- 14825 Maplewood Ave
- 14544 S San Francisco Ave
- 14514 Cooper Ave
- 14715 S Richmond Ave
- 14901 Western Ave
- 14901 S Richmond Ave
- 14727 S Whipple St
- 15001 Western Ave
- 14619 S Albany Ave
- 14622 S Sherman Ave
- 14612 S Sherman Ave
- 14626 S Sherman Ave
- 14610 S Sherman Ave
- 14619 S Campbell Ave
- 14623 S Campbell Ave
- 14608 S Sherman Ave
- 14615 S Campbell Ave
- 14634 S Sherman Ave
- 14621 S Sherman Ave
- 14619 S Sherman Ave
- 14611 S Campbell Ave
- 14627 S Campbell Ave
- 14604 S Sherman Ave
- 14623 S Sherman Ave
- 14611 S Sherman Ave
- 14629 S Sherman Ave
- 14605 S Campbell Ave
- 14552 S Sherman Ave
- 14605 S Sherman Ave