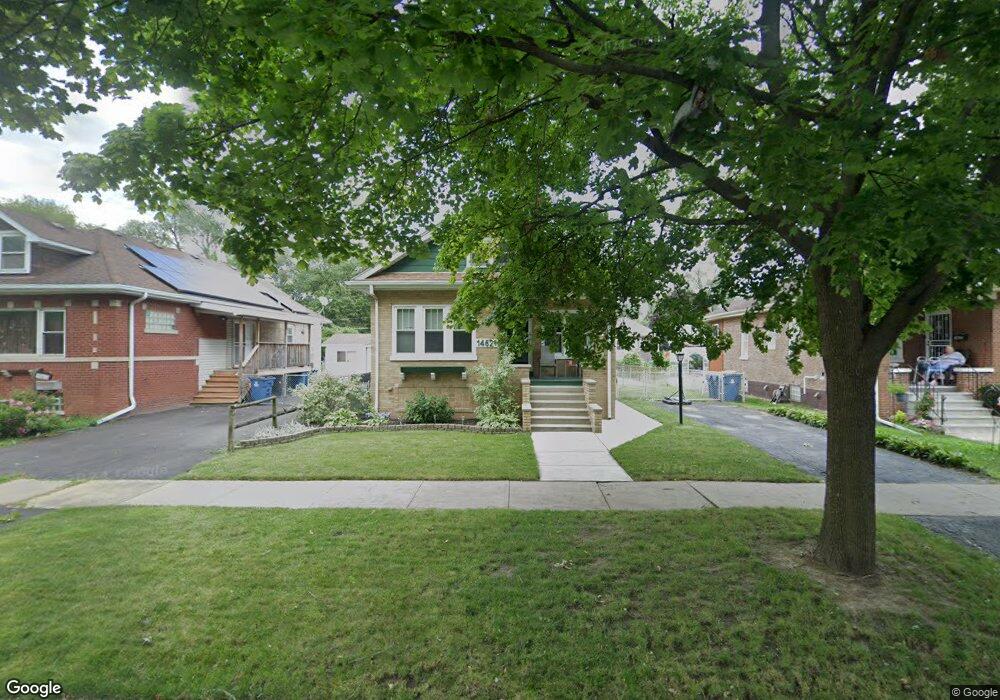
14621 Turner Ave Midlothian, IL 60445
Estimated Value: $202,000 - $207,000
3
Beds
1
Bath
1,054
Sq Ft
$193/Sq Ft
Est. Value
About This Home
This home is located at 14621 Turner Ave, Midlothian, IL 60445 and is currently estimated at $203,527, approximately $193 per square foot. 14621 Turner Ave is a home located in Cook County with nearby schools including Springfield Elementary School, Bremen High School, and St. Christopher School.
Ownership History
Date
Name
Owned For
Owner Type
Purchase Details
Closed on
Apr 8, 2004
Sold by
Marion Barbara Ann
Bought by
Joyce Paul M
Current Estimated Value
Home Financials for this Owner
Home Financials are based on the most recent Mortgage that was taken out on this home.
Original Mortgage
$135,000
Outstanding Balance
$63,529
Interest Rate
5.66%
Mortgage Type
Unknown
Estimated Equity
$139,998
Purchase Details
Closed on
Apr 26, 2000
Sold by
Hud
Bought by
Marion Barbara Ann
Home Financials for this Owner
Home Financials are based on the most recent Mortgage that was taken out on this home.
Original Mortgage
$94,223
Interest Rate
8.26%
Mortgage Type
FHA
Purchase Details
Closed on
Jan 24, 2000
Sold by
Wagner
Bought by
Hud
Purchase Details
Closed on
Nov 22, 1995
Sold by
Ellsworth Janet M
Bought by
Wagner Edna M
Home Financials for this Owner
Home Financials are based on the most recent Mortgage that was taken out on this home.
Original Mortgage
$93,458
Interest Rate
7.44%
Mortgage Type
FHA
Create a Home Valuation Report for This Property
The Home Valuation Report is an in-depth analysis detailing your home's value as well as a comparison with similar homes in the area
Home Values in the Area
Average Home Value in this Area
Purchase History
| Date | Buyer | Sale Price | Title Company |
|---|---|---|---|
| Joyce Paul M | $135,000 | Chicago Title Insurance Co | |
| Marion Barbara Ann | -- | -- | |
| Hud | -- | -- | |
| Wagner Edna M | $95,000 | -- |
Source: Public Records
Mortgage History
| Date | Status | Borrower | Loan Amount |
|---|---|---|---|
| Open | Joyce Paul M | $135,000 | |
| Previous Owner | Marion Barbara Ann | $94,223 | |
| Previous Owner | Wagner Edna M | $93,458 |
Source: Public Records
Tax History Compared to Growth
Tax History
| Year | Tax Paid | Tax Assessment Tax Assessment Total Assessment is a certain percentage of the fair market value that is determined by local assessors to be the total taxable value of land and additions on the property. | Land | Improvement |
|---|---|---|---|---|
| 2024 | $4,043 | $14,001 | $2,328 | $11,673 |
| 2023 | $3,924 | $14,001 | $2,328 | $11,673 |
| 2022 | $3,924 | $11,773 | $1,995 | $9,778 |
| 2021 | $3,814 | $11,773 | $1,995 | $9,778 |
| 2020 | $3,730 | $11,773 | $1,995 | $9,778 |
| 2019 | $3,158 | $10,701 | $1,828 | $8,873 |
| 2018 | $3,106 | $10,701 | $1,828 | $8,873 |
| 2017 | $3,018 | $10,701 | $1,828 | $8,873 |
| 2016 | $3,089 | $9,697 | $1,662 | $8,035 |
| 2015 | $2,967 | $9,697 | $1,662 | $8,035 |
| 2014 | $2,902 | $9,697 | $1,662 | $8,035 |
| 2013 | $2,624 | $9,802 | $1,662 | $8,140 |
Source: Public Records
Map
Nearby Homes
- 14542 Turner Ave
- 14610 Sawyer Ave
- 14517 Saint Louis Ave
- 14732 Turner Ave Unit D
- 3546 147th St
- 14619 S Albany Ave
- 3625 147th St
- 14445 S Albany Ave
- 3631 147th St
- 14503 Waverly Ave
- 3618 148th St
- 14828 S Troy Ave
- 14825 S Troy Ave
- 14727 S Whipple St
- 14839 Lawndale Ave
- 14328 Lawndale Ave
- 3101 Emery Ln
- 3223 Emery Ln
- 14301 Hamlin Ave
- 14544 S San Francisco Ave
- 14617 Turner Ave
- 14627 Turner Ave
- 14611 Turner Ave
- 14633 Turner Ave
- 14620 Spaulding Ave
- 14616 Spaulding Ave
- 14622 Spaulding Ave
- 14609 Turner Ave
- 14637 Turner Ave
- 14612 Spaulding Ave
- 14630 Spaulding Ave
- 14606 Spaulding Ave
- 14622 Turner Ave
- 14622 Turner Ave
- 14601 Turner Ave
- 14643 Turner Ave
- 14636 Spaulding Ave
- 14626 Turner Ave
- 14632 Turner Ave
- 14612 Turner Ave