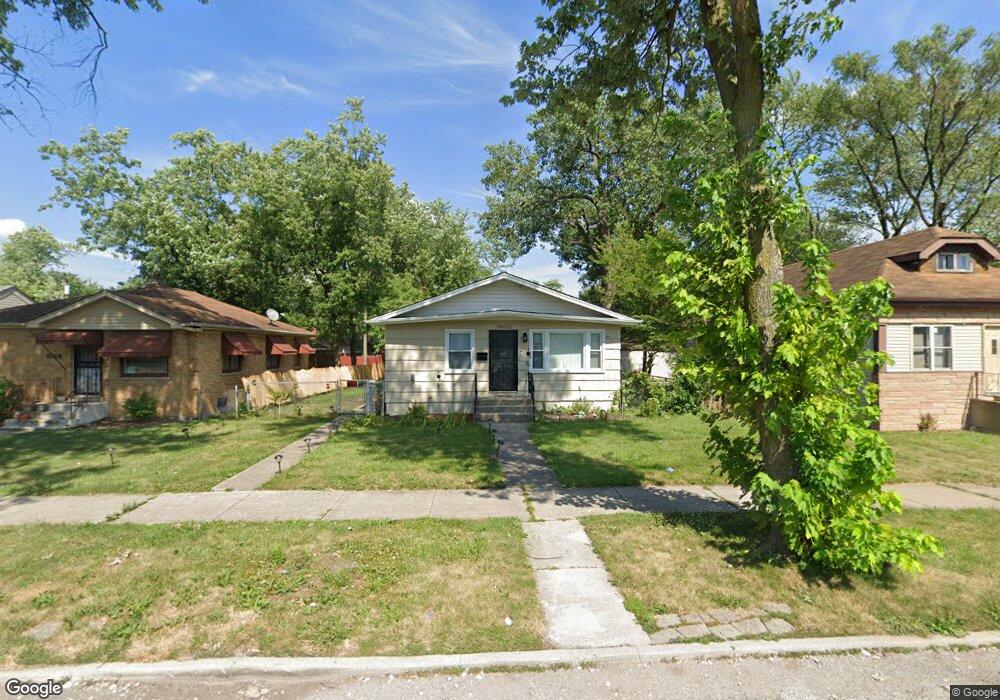
14623 Lexington Ave Harvey, IL 60426
Estimated Value: $89,000 - $166,047
3
Beds
1
Bath
988
Sq Ft
$117/Sq Ft
Est. Value
About This Home
This home is located at 14623 Lexington Ave, Harvey, IL 60426 and is currently estimated at $115,262, approximately $116 per square foot. 14623 Lexington Ave is a home located in Cook County with nearby schools including Riley Early Childhood Center, Brooks Middle School, and Thornton Township High School.
Ownership History
Date
Name
Owned For
Owner Type
Purchase Details
Closed on
Jul 21, 2023
Sold by
Peyton Investment Partners Llc
Bought by
Gallegos Martha
Current Estimated Value
Home Financials for this Owner
Home Financials are based on the most recent Mortgage that was taken out on this home.
Original Mortgage
$176,739
Outstanding Balance
$172,669
Interest Rate
6.98%
Mortgage Type
FHA
Estimated Equity
-$57,407
Purchase Details
Closed on
Apr 13, 2022
Sold by
Taylor Arnold L and The Estate Of Faith D Taylor
Bought by
Peyton Investment Partners Llc
Purchase Details
Closed on
Mar 31, 2022
Sold by
Taylor Arnold L and The Estate Of Faith D Taylor
Bought by
Peyton Investment Partners Llc
Purchase Details
Closed on
Mar 21, 2022
Sold by
Taylor Faith D
Bought by
Peyton Investment Partners Llc
Create a Home Valuation Report for This Property
The Home Valuation Report is an in-depth analysis detailing your home's value as well as a comparison with similar homes in the area
Home Values in the Area
Average Home Value in this Area
Purchase History
| Date | Buyer | Sale Price | Title Company |
|---|---|---|---|
| Gallegos Martha | $180,000 | Chicago Title | |
| Peyton Investment Partners Llc | $40,000 | -- | |
| Peyton Investment Partners Llc | $40,000 | -- | |
| Peyton Investment Partners Llc | $40,000 | Old Republic Title |
Source: Public Records
Mortgage History
| Date | Status | Borrower | Loan Amount |
|---|---|---|---|
| Open | Gallegos Martha | $176,739 |
Source: Public Records
Tax History Compared to Growth
Tax History
| Year | Tax Paid | Tax Assessment Tax Assessment Total Assessment is a certain percentage of the fair market value that is determined by local assessors to be the total taxable value of land and additions on the property. | Land | Improvement |
|---|---|---|---|---|
| 2024 | $1,869 | $5,514 | $1,289 | $4,225 |
| 2023 | $641 | $5,514 | $1,289 | $4,225 |
| 2022 | $641 | $3,525 | $1,289 | $2,236 |
| 2021 | $676 | $3,524 | $1,288 | $2,236 |
| 2020 | $841 | $3,524 | $1,288 | $2,236 |
| 2019 | $1,137 | $4,209 | $1,171 | $3,038 |
| 2018 | $1,106 | $4,209 | $1,171 | $3,038 |
| 2017 | $1,116 | $4,209 | $1,171 | $3,038 |
| 2016 | $1,504 | $4,321 | $1,054 | $3,267 |
| 2015 | $1,382 | $4,321 | $1,054 | $3,267 |
| 2014 | $1,405 | $4,321 | $1,054 | $3,267 |
| 2013 | $1,960 | $5,326 | $1,054 | $4,272 |
Source: Public Records
Map
Nearby Homes
- 14616 Loomis Ave
- 14600 Loomis Ave
- 14540 Loomis Ave
- 14523 Lexington Ave
- 14543 Myrtle Ave
- 14519 Harvey Ave
- 14735 Myrtle Ave
- 14502 Kentucky Ave
- 14725 Turlington Ave
- 111 E 144th Ct
- 14637 Center Ave
- 14622 Vincennes Rd
- 14542 Sangamon St
- 14817 Lexington Ave
- 14631 Vincennes Rd
- 14637 Vincennes Rd
- 14458 Peoria St
- 14900 Vine Ave
- 14452 Green St
- 14807 Paulina St
- 14623 Lexington Ave
- 14619 Lexington Ave
- 14627 Lexington Ave
- 14615 Lexington Ave
- 14615 Lexington Ave
- 14631 Lexington Ave
- 14611 Lexington Ave
- 14611 Lexington Ave
- 14622 Harvey Ave
- 14624 Harvey Ave
- 14618 Harvey Ave
- 14618 Harvey Ave
- 14628 Harvey Ave
- 14630 Harvey Ave
- 14630 Harvey Ave
- 14612 Harvey Ave
- 14620 Lexington Ave
- 14609 Lexington Ave
- 14609 Lexington Ave
- 14628 Lexington Ave