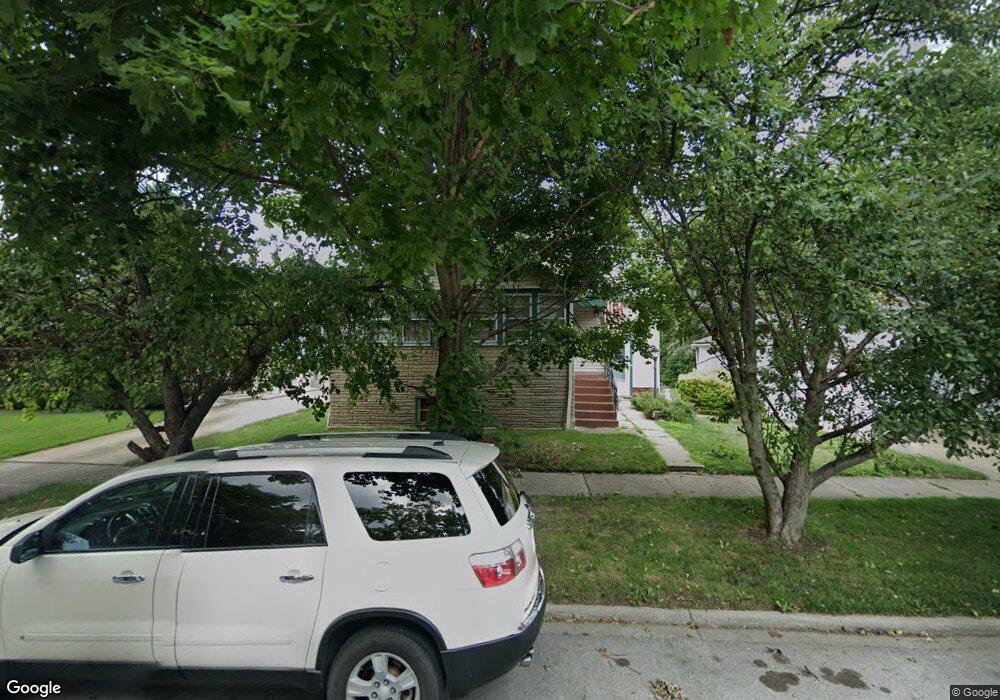
14627 Spaulding Ave Midlothian, IL 60445
Estimated Value: $209,853 - $227,000
3
Beds
1
Bath
1,444
Sq Ft
$150/Sq Ft
Est. Value
About This Home
This home is located at 14627 Spaulding Ave, Midlothian, IL 60445 and is currently estimated at $216,463, approximately $149 per square foot. 14627 Spaulding Ave is a home located in Cook County with nearby schools including Springfield Elementary School, Bremen High School, and St. Christopher School.
Ownership History
Date
Name
Owned For
Owner Type
Purchase Details
Closed on
Apr 14, 2021
Sold by
Hussey John F and Hussey Pamela R
Bought by
Hussey John F and Hussey Pamela R
Current Estimated Value
Purchase Details
Closed on
Dec 22, 1998
Sold by
Hussey John F
Bought by
Hussey John F and Hussey Pamela R
Home Financials for this Owner
Home Financials are based on the most recent Mortgage that was taken out on this home.
Original Mortgage
$88,000
Interest Rate
6.83%
Purchase Details
Closed on
Jun 2, 1998
Sold by
Hussey Pamela R
Bought by
Hussey John F
Purchase Details
Closed on
May 28, 1997
Sold by
Hussey John F and Hussey Pamela R
Bought by
Hussey Pamela R
Home Financials for this Owner
Home Financials are based on the most recent Mortgage that was taken out on this home.
Original Mortgage
$75,000
Interest Rate
8.17%
Create a Home Valuation Report for This Property
The Home Valuation Report is an in-depth analysis detailing your home's value as well as a comparison with similar homes in the area
Home Values in the Area
Average Home Value in this Area
Purchase History
| Date | Buyer | Sale Price | Title Company |
|---|---|---|---|
| Hussey John F | -- | Accommodation | |
| Hussey John F | -- | -- | |
| Hussey John F | -- | -- | |
| Hussey Pamela R | -- | Land Title Group Inc |
Source: Public Records
Mortgage History
| Date | Status | Borrower | Loan Amount |
|---|---|---|---|
| Closed | Hussey John F | $88,000 | |
| Closed | Hussey Pamela R | $75,000 |
Source: Public Records
Tax History
| Year | Tax Paid | Tax Assessment Tax Assessment Total Assessment is a certain percentage of the fair market value that is determined by local assessors to be the total taxable value of land and additions on the property. | Land | Improvement |
|---|---|---|---|---|
| 2025 | $3,418 | $15,001 | $2,328 | $12,673 |
| 2024 | $3,418 | $15,001 | $2,328 | $12,673 |
| 2023 | $2,746 | $15,001 | $2,328 | $12,673 |
| 2022 | $2,746 | $12,002 | $1,995 | $10,007 |
| 2021 | $2,713 | $12,002 | $1,995 | $10,007 |
| 2020 | $2,761 | $12,002 | $1,995 | $10,007 |
| 2019 | $2,602 | $12,164 | $1,828 | $10,336 |
| 2018 | $2,556 | $12,164 | $1,828 | $10,336 |
| 2017 | $2,508 | $12,164 | $1,828 | $10,336 |
| 2016 | $2,688 | $10,545 | $1,662 | $8,883 |
| 2015 | $2,537 | $10,545 | $1,662 | $8,883 |
| 2014 | $2,500 | $10,545 | $1,662 | $8,883 |
| 2013 | $2,496 | $11,331 | $1,662 | $9,669 |
Source: Public Records
Map
Nearby Homes
- 14832 Clifton Park Ave
- 3625 147th St
- 3618 148th St
- 14544 S San Francisco Ave
- 14925 Whipple Ave
- 3642 147th Place
- 14503 Waverly Ave
- 14828 S San Francisco Ave
- 2918 143rd Place
- 3206 Kinne Rd
- 3127 141st Place
- 3131 141st Place
- 14328 Lawndale Ave
- 14301 Hamlin Ave
- 14600 S Cleveland Ave
- 14044 S Grace Ave
- 2928 W 143rd St
- 2900 141st Place
- 15031 Hamlin Ave
- 14039 S Claire Blvd
- 14623 Spaulding Ave
- 14617 Spaulding Ave
- 14637 Spaulding Ave
- 14626 Sawyer Ave
- 14622 Sawyer Ave
- 14611 Spaulding Ave
- 14641 Spaulding Ave
- 14616 Sawyer Ave
- 14630 Sawyer Ave
- 14622 Spaulding Ave
- 14607 Spaulding Ave
- 14642 Sawyer Ave
- 14630 Spaulding Ave
- 14620 Spaulding Ave
- 14636 Spaulding Ave
- 14616 Spaulding Ave
- 14604 Sawyer Ave
- 14640 Spaulding Ave
- 14601 Spaulding Ave
- 14612 Spaulding Ave
Your Personal Tour Guide
Ask me questions while you tour the home.