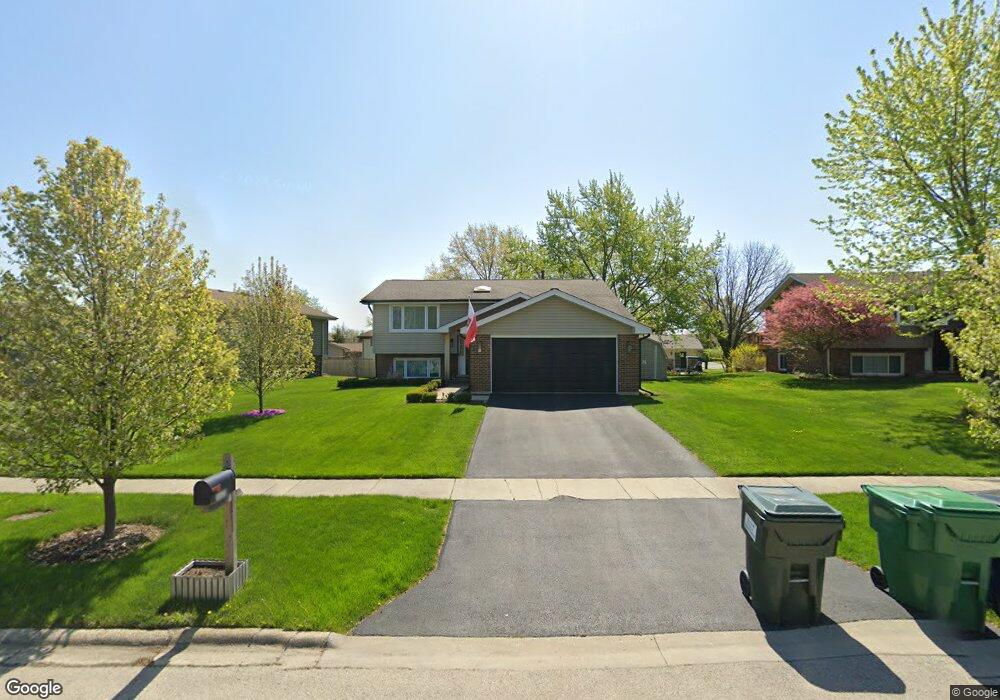
14628 S Arboretum Dr Homer Glen, IL 60491
Estimated Value: $375,140 - $409,000
3
Beds
2
Baths
1,187
Sq Ft
$328/Sq Ft
Est. Value
About This Home
This home is located at 14628 S Arboretum Dr, Homer Glen, IL 60491 and is currently estimated at $388,785, approximately $327 per square foot. 14628 S Arboretum Dr is a home located in Will County with nearby schools including Goodings Grove School, Hadley Middle School, and Homer Jr High School.
Ownership History
Date
Name
Owned For
Owner Type
Purchase Details
Closed on
Apr 3, 2012
Sold by
Bujwit Kathleen J
Bought by
Czernik Tadeusz and Cebrat Czernik Marta
Current Estimated Value
Home Financials for this Owner
Home Financials are based on the most recent Mortgage that was taken out on this home.
Original Mortgage
$137,500
Outstanding Balance
$94,928
Interest Rate
3.9%
Mortgage Type
New Conventional
Estimated Equity
$293,857
Purchase Details
Closed on
Mar 27, 2012
Sold by
Bujwit Robert J
Bought by
Czernik Tadeusz and Cebrat Czernik Maria
Home Financials for this Owner
Home Financials are based on the most recent Mortgage that was taken out on this home.
Original Mortgage
$137,500
Outstanding Balance
$94,928
Interest Rate
3.9%
Mortgage Type
New Conventional
Estimated Equity
$293,857
Purchase Details
Closed on
Dec 14, 1984
Bought by
Czernik Tadeusz
Create a Home Valuation Report for This Property
The Home Valuation Report is an in-depth analysis detailing your home's value as well as a comparison with similar homes in the area
Home Values in the Area
Average Home Value in this Area
Purchase History
| Date | Buyer | Sale Price | Title Company |
|---|---|---|---|
| Czernik Tadeusz | -- | Citywide Title Corporation | |
| Czernik Tadeusz | $145,000 | Citywide Title Corporation | |
| Czernik Tadeusz | $16,500 | -- |
Source: Public Records
Mortgage History
| Date | Status | Borrower | Loan Amount |
|---|---|---|---|
| Open | Czernik Tadeusz | $137,500 |
Source: Public Records
Tax History Compared to Growth
Tax History
| Year | Tax Paid | Tax Assessment Tax Assessment Total Assessment is a certain percentage of the fair market value that is determined by local assessors to be the total taxable value of land and additions on the property. | Land | Improvement |
|---|---|---|---|---|
| 2024 | $7,008 | $104,531 | $20,064 | $84,467 |
| 2023 | $7,008 | $94,752 | $18,187 | $76,565 |
| 2022 | $6,713 | $64,554 | $16,981 | $47,573 |
| 2021 | $4,313 | $61,160 | $16,088 | $45,072 |
| 2020 | $4,316 | $58,910 | $15,496 | $43,414 |
| 2019 | $4,103 | $56,671 | $14,907 | $41,764 |
| 2018 | $3,999 | $54,819 | $14,736 | $40,083 |
| 2017 | $3,917 | $53,046 | $14,323 | $38,723 |
| 2016 | $3,813 | $51,277 | $13,845 | $37,432 |
| 2015 | $3,633 | $49,352 | $13,325 | $36,027 |
| 2014 | $3,633 | $48,333 | $13,050 | $35,283 |
| 2013 | $3,633 | $48,333 | $13,050 | $35,283 |
Source: Public Records
Map
Nearby Homes
- 14653 S Cricketwood Ct Unit 3
- 14627 S Pebble Creek Dr
- 13734 W Birchwood Dr
- 13766 W Deervalley Dr
- 12808 W Timberlane Ct
- 14420 S Elizabeth Ln
- 13743 W Carefree Dr
- 13521 W Catawba Ln
- 14344 Dixon Ln
- 14459 Gatses Ln
- 13408 W Catawba Ln
- 15430 Sulky Dr
- 13226 Farm View St
- 14761 Marilynn Ln
- 13929 S Teakwood Dr
- 13116 Woodland Dr
- 13735 W Meath Dr
- 14541 S Bell Rd
- 14453 S Bell Rd
- 14542 S Mustang Dr
- 14626 S Arboretum Dr
- 14630 S Arboretum Dr
- 14632 S Arboretum Dr Unit 3
- 14624 S Arboretum Dr
- 14654 S Cricketwood Ct
- 14623 S Arboretum Dr
- 14638 S Cricketwood Ct
- 14625 S Arboretum Dr
- 14634 S Arboretum Dr
- 14662 S Cricketwood Ct
- 14622 S Arboretum Dr
- 14627 S Arboretum Dr
- 13815 W Shady Ln
- 14621 S Arboretum Dr
- 14636 S Arboretum Dr
- 14635 S Cricketwood Ct
- 14629 S Arboretum Dr
- 13806 W Shady Ln
- 14704 S Cricketwood Ct
- 14663 S Cricketwood Ct