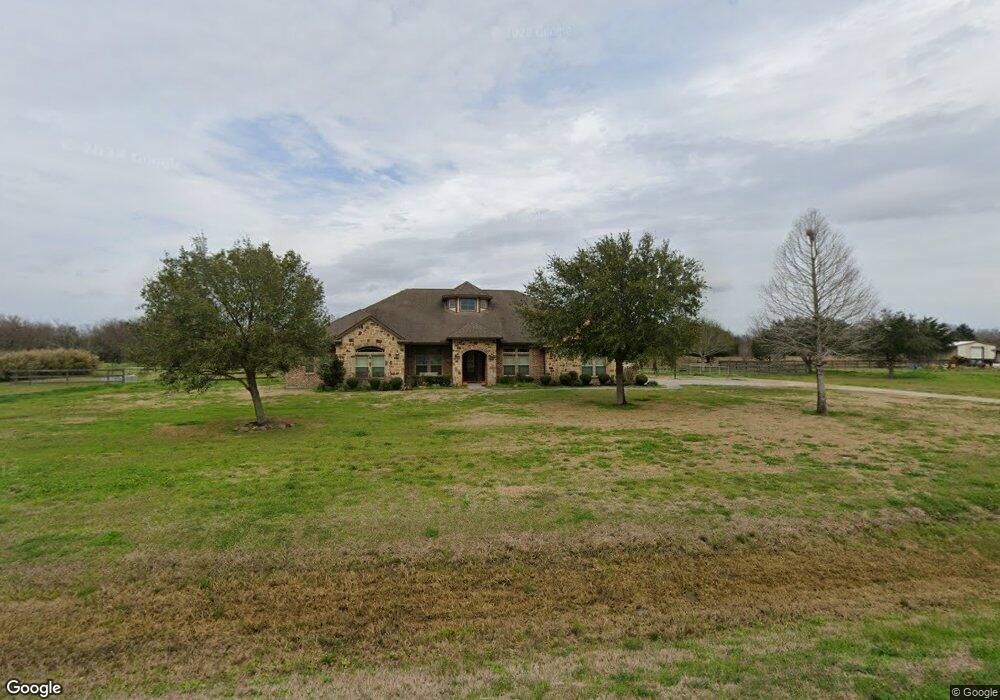
14629 Dove Ln Needville, TX 77461
Estimated Value: $700,000 - $899,000
4
Beds
4
Baths
3,658
Sq Ft
$221/Sq Ft
Est. Value
About This Home
This home is located at 14629 Dove Ln, Needville, TX 77461 and is currently estimated at $807,426, approximately $220 per square foot. 14629 Dove Ln is a home with nearby schools including Needville Elementary School, Needville Junior High School, and Needville Middle School.
Ownership History
Date
Name
Owned For
Owner Type
Purchase Details
Closed on
Jan 30, 2025
Sold by
Pollard Michael K and Pollard Sandra E
Bought by
Lutz Jeffrey D and Lutz Darlene K
Current Estimated Value
Home Financials for this Owner
Home Financials are based on the most recent Mortgage that was taken out on this home.
Original Mortgage
$620,000
Outstanding Balance
$604,750
Interest Rate
5.92%
Mortgage Type
New Conventional
Estimated Equity
$202,676
Purchase Details
Closed on
Dec 14, 2010
Sold by
Hedt Darrin W and Hedt Jacey E
Bought by
Pollard Michael K and Pollard Sandra E
Purchase Details
Closed on
Jun 13, 2001
Sold by
Ley Hugo F
Bought by
Hedt Darrin W and Hedt Jacey E
Home Financials for this Owner
Home Financials are based on the most recent Mortgage that was taken out on this home.
Original Mortgage
$10,400
Interest Rate
7.75%
Create a Home Valuation Report for This Property
The Home Valuation Report is an in-depth analysis detailing your home's value as well as a comparison with similar homes in the area
Home Values in the Area
Average Home Value in this Area
Purchase History
| Date | Buyer | Sale Price | Title Company |
|---|---|---|---|
| Lutz Jeffrey D | -- | Fidelity National Title | |
| Pollard Michael K | -- | Stewart Title Richmond | |
| Hedt Darrin W | -- | American Title Co |
Source: Public Records
Mortgage History
| Date | Status | Borrower | Loan Amount |
|---|---|---|---|
| Open | Lutz Jeffrey D | $620,000 | |
| Previous Owner | Hedt Darrin W | $10,400 |
Source: Public Records
Tax History Compared to Growth
Tax History
| Year | Tax Paid | Tax Assessment Tax Assessment Total Assessment is a certain percentage of the fair market value that is determined by local assessors to be the total taxable value of land and additions on the property. | Land | Improvement |
|---|---|---|---|---|
| 2025 | $12,578 | $823,570 | $170,000 | $843,236 |
| 2024 | $12,578 | $748,700 | $60,740 | $687,960 |
| 2023 | $12,578 | $680,636 | $0 | $698,042 |
| 2022 | $11,138 | $618,760 | $11,300 | $607,460 |
| 2021 | $10,664 | $562,510 | $64,750 | $497,760 |
| 2020 | $10,613 | $525,010 | $64,750 | $460,260 |
| 2019 | $11,578 | $539,290 | $64,750 | $474,540 |
| 2018 | $11,495 | $536,000 | $62,250 | $473,750 |
| 2017 | $11,205 | $520,920 | $40,000 | $480,920 |
| 2016 | $11,205 | $520,920 | $34,700 | $486,220 |
| 2015 | $9,601 | $477,700 | $36,610 | $441,090 |
| 2014 | $8,977 | $434,270 | $36,610 | $397,660 |
Source: Public Records
Map
Nearby Homes
- 14624 Dove Ln
- 0 Colony Rd
- 3819 Willow Breeze
- 14210 Cally Cir
- 14238 Hay Meadow Ln
- 14234 Hay Meadow Ln
- 3818 Founders Dr
- 3811 Candlewood Cir
- 00 Hurta
- 14218 Golden Wheat Ln
- 14935 Highway 36
- 14218 Hay Meadow Ln
- 14214 Hay Meadow Ln
- 14235 Hay Meadow Ln
- 14231 Hay Meadow Ln
- 14222 Hay Meadow Ln
- 14239 Hay Meadow Ln
- 14227 Hay Meadow Ln
- 14226 Hay Meadow Ln
- 14230 Hay Meadow Ln