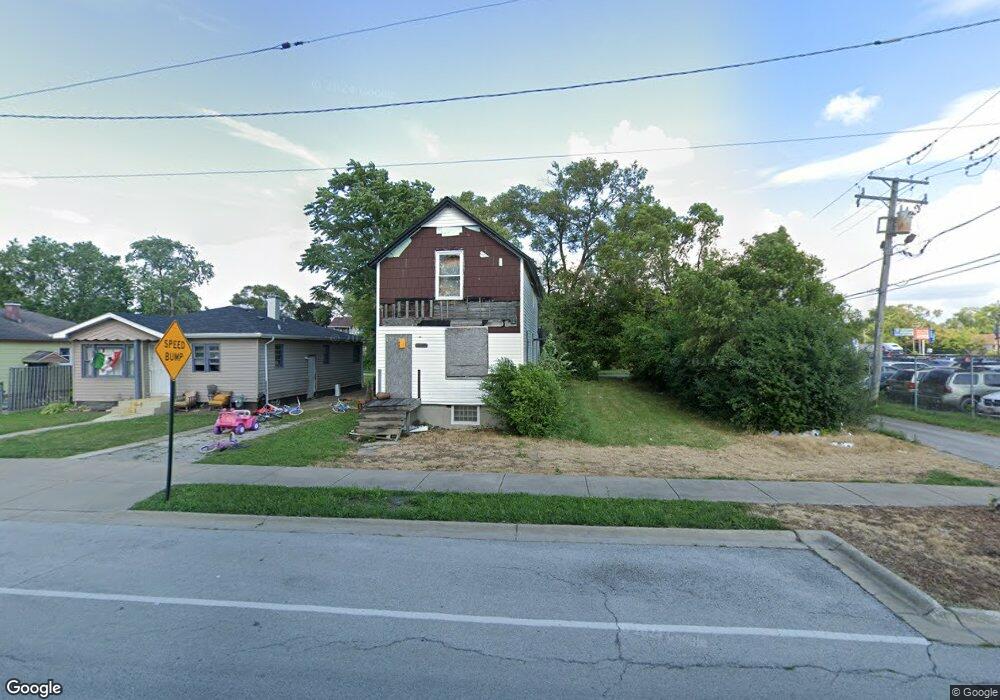
14629 Loomis Ave Harvey, IL 60426
Estimated Value: $107,481 - $119,000
3
Beds
1
Bath
1,152
Sq Ft
$98/Sq Ft
Est. Value
About This Home
This home is located at 14629 Loomis Ave, Harvey, IL 60426 and is currently estimated at $112,370, approximately $97 per square foot. 14629 Loomis Ave is a home located in Cook County with nearby schools including Riley Early Childhood Center, Brooks Middle School, and Thornton Township High School.
Ownership History
Date
Name
Owned For
Owner Type
Purchase Details
Closed on
Jan 12, 2009
Sold by
Muhammad Ernest
Bought by
The Bank Of New York Mellon Trust Compan and The Bank Of New York Trust Company Na
Current Estimated Value
Purchase Details
Closed on
Jan 12, 2006
Sold by
Johnson Howell
Bought by
Muhammad Ernest
Home Financials for this Owner
Home Financials are based on the most recent Mortgage that was taken out on this home.
Original Mortgage
$76,000
Interest Rate
6.46%
Mortgage Type
Fannie Mae Freddie Mac
Purchase Details
Closed on
May 17, 2000
Sold by
First Trust Natl Assoc
Bought by
Johnson Howell
Home Financials for this Owner
Home Financials are based on the most recent Mortgage that was taken out on this home.
Original Mortgage
$31,000
Interest Rate
8.27%
Mortgage Type
Credit Line Revolving
Purchase Details
Closed on
Dec 23, 1999
Sold by
Richards Brady E
Bought by
Salomon Bros Mtg Sec Vii Inc
Create a Home Valuation Report for This Property
The Home Valuation Report is an in-depth analysis detailing your home's value as well as a comparison with similar homes in the area
Home Values in the Area
Average Home Value in this Area
Purchase History
| Date | Buyer | Sale Price | Title Company |
|---|---|---|---|
| The Bank Of New York Mellon Trust Compan | -- | None Available | |
| Muhammad Ernest | $80,000 | First American Title | |
| Johnson Howell | $20,000 | -- | |
| Salomon Bros Mtg Sec Vii Inc | -- | -- |
Source: Public Records
Mortgage History
| Date | Status | Borrower | Loan Amount |
|---|---|---|---|
| Previous Owner | Muhammad Ernest | $76,000 | |
| Previous Owner | Johnson Howell | $31,000 |
Source: Public Records
Tax History Compared to Growth
Tax History
| Year | Tax Paid | Tax Assessment Tax Assessment Total Assessment is a certain percentage of the fair market value that is determined by local assessors to be the total taxable value of land and additions on the property. | Land | Improvement |
|---|---|---|---|---|
| 2024 | $3,791 | $5,800 | $859 | $4,941 |
| 2023 | $1,931 | $5,800 | $859 | $4,941 |
| 2022 | $1,931 | $2,374 | $859 | $1,515 |
| 2021 | $1,865 | $2,374 | $859 | $1,515 |
| 2020 | $1,916 | $2,374 | $859 | $1,515 |
| 2019 | $3,450 | $4,445 | $781 | $3,664 |
| 2018 | $3,366 | $4,445 | $781 | $3,664 |
| 2017 | $3,289 | $4,445 | $781 | $3,664 |
| 2016 | $3,004 | $4,640 | $703 | $3,937 |
| 2015 | $2,884 | $4,640 | $703 | $3,937 |
| 2014 | $2,877 | $4,640 | $703 | $3,937 |
| 2013 | $3,279 | $5,391 | $703 | $4,688 |
Source: Public Records
Map
Nearby Homes
- 14616 Loomis Ave
- 14600 Loomis Ave
- 14540 Loomis Ave
- 14543 Myrtle Ave
- 14735 Myrtle Ave
- 14523 Lexington Ave
- 14519 Harvey Ave
- 14725 Turlington Ave
- 14817 Lexington Ave
- 14637 Center Ave
- 14502 Kentucky Ave
- 111 E 144th Ct
- 14622 Vincennes Rd
- 14542 Sangamon St
- 14631 Vincennes Rd
- 14637 Vincennes Rd
- 14900 Vine Ave
- 14458 Peoria St
- 14807 Paulina St
- 14452 Green St
- 14627 Loomis Ave
- 14627 Loomis Ave
- 14629 Loomis Ave
- 14623 Loomis Ave
- 14619 Loomis Ave
- 14628 Lexington Ave
- 14628 Lexington Ave
- 14630 Lexington Ave
- 14620 Lexington Ave
- 14617 Loomis Ave
- 14632 Loomis Ave
- 14624 Loomis Ave
- 14611 Loomis Ave
- 14618 Loomis Ave
- 14614 Lexington Ave
- 14612 Loomis Ave Unit 1
- 14612 Loomis Ave Unit garden
- 14612 Loomis Ave
- 14610 Lexington Ave
- 14610 Lexington Ave