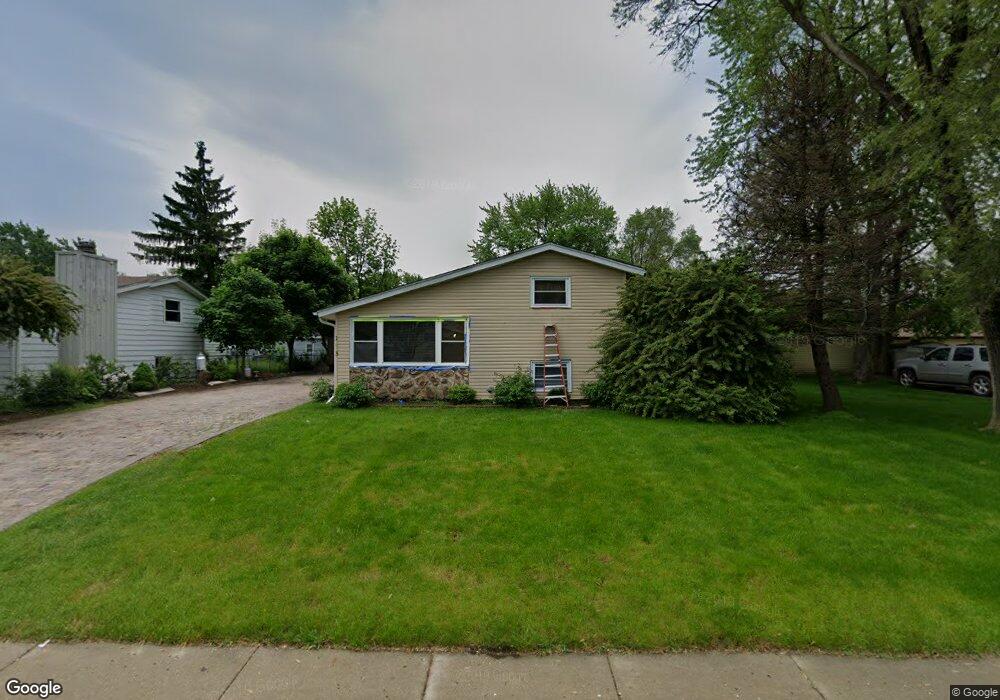
1463 Kings Rd Carpentersville, IL 60110
Estimated Value: $268,092 - $308,000
3
Beds
--
Bath
1,628
Sq Ft
$178/Sq Ft
Est. Value
About This Home
This home is located at 1463 Kings Rd, Carpentersville, IL 60110 and is currently estimated at $290,523, approximately $178 per square foot. 1463 Kings Rd is a home located in Kane County with nearby schools including Lakewood School, Crescent City Grade School, and Carpentersville Middle School.
Ownership History
Date
Name
Owned For
Owner Type
Purchase Details
Closed on
Oct 30, 2017
Sold by
Silva Martin and Desilva Cortez De
Bought by
Silva Martin and Silva Josefina Cortez De
Current Estimated Value
Purchase Details
Closed on
Dec 1, 2012
Sold by
Silva Victorio
Bought by
Silva Martin
Purchase Details
Closed on
May 28, 1999
Sold by
Grube Roger W and Grube Ruby L
Bought by
Silva Martin and Silva Victoria
Home Financials for this Owner
Home Financials are based on the most recent Mortgage that was taken out on this home.
Original Mortgage
$112,321
Outstanding Balance
$30,209
Interest Rate
7.29%
Mortgage Type
FHA
Estimated Equity
$260,314
Purchase Details
Closed on
Apr 3, 1996
Sold by
Litton Loan Servicing Inc
Bought by
Grube Roger W and Grube Ruby L
Home Financials for this Owner
Home Financials are based on the most recent Mortgage that was taken out on this home.
Original Mortgage
$16,245
Interest Rate
7.99%
Create a Home Valuation Report for This Property
The Home Valuation Report is an in-depth analysis detailing your home's value as well as a comparison with similar homes in the area
Home Values in the Area
Average Home Value in this Area
Purchase History
| Date | Buyer | Sale Price | Title Company |
|---|---|---|---|
| Silva Martin | -- | Attorney | |
| Silva Martin | -- | None Available | |
| Silva Martin | $112,500 | -- | |
| Grube Roger W | $16,245 | -- |
Source: Public Records
Mortgage History
| Date | Status | Borrower | Loan Amount |
|---|---|---|---|
| Open | Silva Martin | $112,321 | |
| Previous Owner | Grube Roger W | $16,245 |
Source: Public Records
Tax History Compared to Growth
Tax History
| Year | Tax Paid | Tax Assessment Tax Assessment Total Assessment is a certain percentage of the fair market value that is determined by local assessors to be the total taxable value of land and additions on the property. | Land | Improvement |
|---|---|---|---|---|
| 2024 | $5,213 | $76,836 | $12,553 | $64,283 |
| 2023 | $5,137 | $69,135 | $11,295 | $57,840 |
| 2022 | $4,778 | $60,871 | $11,295 | $49,576 |
| 2021 | $4,663 | $57,475 | $10,665 | $46,810 |
| 2020 | $4,584 | $56,183 | $10,425 | $45,758 |
| 2019 | $4,479 | $53,335 | $9,897 | $43,438 |
| 2018 | $4,127 | $47,582 | $9,701 | $37,881 |
| 2017 | $3,950 | $44,511 | $9,075 | $35,436 |
| 2016 | $3,628 | $38,974 | $8,787 | $30,187 |
| 2015 | -- | $32,130 | $8,234 | $23,896 |
| 2014 | -- | $28,753 | $8,007 | $20,746 |
| 2013 | -- | $29,633 | $8,252 | $21,381 |
Source: Public Records
Map
Nearby Homes
- 105 Siesta Rd
- 1426 Kings Rd
- 200 Amarillo Dr
- 171 Lake Shore Dr
- 308 Amarillo Ct
- 140 Hickory Dr
- 149 Austin Ave
- 181 Skyline Dr
- 157 Austin Ave
- 103 Hickory Dr
- 327 Tulsa Ave
- 1431 Silverstone Dr Unit 1416
- 2013 Silverstone Dr Unit 2013
- 7 Austin Ave
- 135 Indian Ln
- 4 Austin Ave
- 1309 Silverstone Dr Unit 1305
- 1303 Silverstone Dr Unit 1302
- 713 Silverstone Dr Unit 77
- 57 Robin Rd
- 1461 Kings Rd
- 1465 Kings Rd
- 1546 Amarillo Dr
- 1542 Amarillo Dr
- 1459 Kings Rd
- 1540 Amarillo Dr
- 1544 Amarillo Dr
- 1464 Kings Rd
- 1538 Amarillo Dr
- 1466 Kings Rd
- 1462 Kings Rd
- 1457 Kings Rd
- 1460 Kings Rd
- 1536 Amarillo Dr
- 000 Kings Rd
- 1458 Kings Rd
- 1455 Kings Rd
- 1553 Amarillo Dr
- 1534 Amarillo Dr
- 1543 Amarillo Dr