

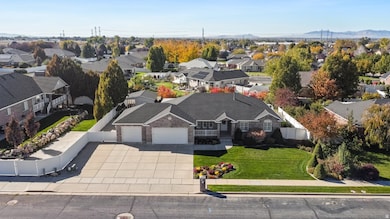
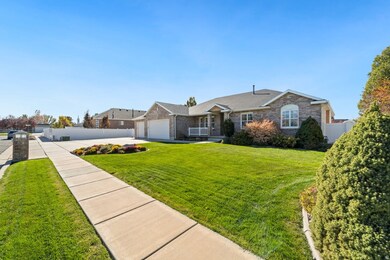
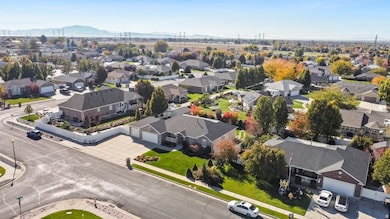

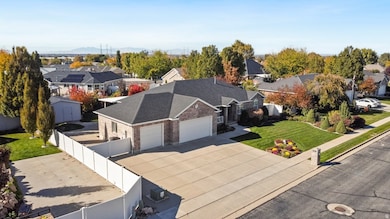
1463 N 1250 W Clearfield, UT 84015
Estimated payment $4,233/month
Highlights
- Second Kitchen
- Updated Kitchen
- Mountain View
- RV or Boat Parking
- Mature Trees
- Private Lot
About This Home
Beautifully Updated Rambler in a Fantastic Neighborhood! Come see this stunning, super-clean, and well-maintained 5-bedroom rambler in an amazing location-close to shopping, dining, and entertainment. This Mitchell custom-built home has been tastefully updated and includes numerous upgrades throughout. Enjoy a fully finished basement complete with a second kitchen, full bath, two bedrooms, utility rooms, and plenty of storage space. The spacious three-car garage provides ample room for tools and toys, along with additional storage options. Outside, you'll find a large driveway with RV parking, a big storage shed, and a beautifully landscaped, fully fenced yard and a three year old roof. The expansive covered patio is perfect for relaxing or entertaining guests year-round.
Listing Agent
Craig Hansen
Ridgeline Realty License #11324807 Listed on: 10/28/2025
Home Details
Home Type
- Single Family
Est. Annual Taxes
- $3,700
Year Built
- Built in 1999
Lot Details
- 0.29 Acre Lot
- Property is Fully Fenced
- Landscaped
- Private Lot
- Mature Trees
- Vegetable Garden
- Zoning described as R-1-10
Parking
- 3 Car Attached Garage
- 6 Open Parking Spaces
- RV or Boat Parking
Home Design
- Rambler Architecture
- Brick Exterior Construction
- Asphalt
- Stucco
Interior Spaces
- 4,551 Sq Ft Home
- 2-Story Property
- Central Vacuum
- Ceiling Fan
- 2 Fireplaces
- Gas Log Fireplace
- Double Pane Windows
- Plantation Shutters
- Entrance Foyer
- Great Room
- Mountain Views
- Basement Fills Entire Space Under The House
- Gas Dryer Hookup
Kitchen
- Updated Kitchen
- Second Kitchen
- Range Hood
- Microwave
- Granite Countertops
- Disposal
Flooring
- Carpet
- Laminate
- Tile
Bedrooms and Bathrooms
- 5 Bedrooms | 3 Main Level Bedrooms
- Primary Bedroom on Main
- Walk-In Closet
- In-Law or Guest Suite
- Hydromassage or Jetted Bathtub
Outdoor Features
- Covered Patio or Porch
- Storage Shed
- Outbuilding
Schools
- Clinton Elementary School
- Sunset Middle School
- Clearfield High School
Utilities
- Central Heating and Cooling System
- Natural Gas Connected
Additional Features
- ADA Inside
- Reclaimed Water Irrigation System
Community Details
- No Home Owners Association
- Ridge Sub Subdivision
Listing and Financial Details
- Exclusions: Dryer, Refrigerator, Washer
- Assessor Parcel Number 14-247-0036
Map
Home Values in the Area
Average Home Value in this Area
Tax History
| Year | Tax Paid | Tax Assessment Tax Assessment Total Assessment is a certain percentage of the fair market value that is determined by local assessors to be the total taxable value of land and additions on the property. | Land | Improvement |
|---|---|---|---|---|
| 2025 | $805 | $341,550 | $102,807 | $238,743 |
| 2024 | $805 | $330,550 | $111,648 | $218,902 |
| 2023 | $1,286 | $666,000 | $129,416 | $536,584 |
| 2022 | $2,545 | $393,800 | $76,271 | $317,529 |
| 2021 | $1,897 | $529,000 | $100,406 | $428,594 |
| 2020 | $1,466 | $460,000 | $88,033 | $371,967 |
| 2019 | $1,498 | $455,000 | $97,884 | $357,116 |
| 2018 | $1,236 | $409,000 | $82,044 | $326,956 |
| 2016 | $737 | $179,685 | $32,499 | $147,186 |
| 2015 | $2,482 | $169,895 | $32,499 | $137,396 |
| 2014 | $1,355 | $168,709 | $32,499 | $136,210 |
| 2013 | -- | $164,728 | $31,094 | $133,634 |
Property History
| Date | Event | Price | List to Sale | Price per Sq Ft |
|---|---|---|---|---|
| 10/28/2025 10/28/25 | For Sale | $749,900 | -- | $165 / Sq Ft |
Purchase History
| Date | Type | Sale Price | Title Company |
|---|---|---|---|
| Warranty Deed | -- | Heritage West Title Ins Agen | |
| Interfamily Deed Transfer | -- | Advanced Title | |
| Corporate Deed | -- | Founders Title Co |
Mortgage History
| Date | Status | Loan Amount | Loan Type |
|---|---|---|---|
| Previous Owner | $229,500 | Adjustable Rate Mortgage/ARM | |
| Previous Owner | $167,820 | No Value Available |
Source: UtahRealEstate.com
MLS Number: 2119849
APN: 14-247-0036
Disclaimer: Certain information contained herein is derived from information provided by parties other than Homes.com. All information provided is deemed reliable, but is not guaranteed to be accurate and should be independently verified.
![]() IDX information is provided exclusively for consumers’ personal, non-commercial use, that it may not be used for any purpose other than to identify prospective properties consumers may be interested in purchasing, and that the data is deemed reliable but is not guaranteed accurate by the MLS. Licensor is only providing the MLS Content and not other sources of data provided in the Product.
IDX information is provided exclusively for consumers’ personal, non-commercial use, that it may not be used for any purpose other than to identify prospective properties consumers may be interested in purchasing, and that the data is deemed reliable but is not guaranteed accurate by the MLS. Licensor is only providing the MLS Content and not other sources of data provided in the Product.
Based on information from the Wasatch Front Regional Multiple Listing Service, Inc.. All data, including all measurements and calculations of area, is obtained from various sources and has not been, and will not be, verified by broker or the MLS. All information should be independently reviewed and verified for accuracy. Properties may or may not be listed by the office/agent presenting the information.