1463 Spring Crest Cir Unit B9 Latrobe, PA 15650
Estimated Value: $181,000 - $207,000
--
Bed
--
Bath
932
Sq Ft
$205/Sq Ft
Est. Value
About This Home
This home is located at 1463 Spring Crest Cir Unit B9, Latrobe, PA 15650 and is currently estimated at $190,788, approximately $204 per square foot. 1463 Spring Crest Cir Unit B9 is a home located in Westmoreland County with nearby schools including Grandview Elementary, Derry Area Middle School, and Derry Area Senior High School.
Ownership History
Date
Name
Owned For
Owner Type
Purchase Details
Closed on
Jul 16, 2025
Sold by
Short Donna L and Heckathorn Cindy S
Bought by
Rudy Richard J and Rudy Janice M
Current Estimated Value
Home Financials for this Owner
Home Financials are based on the most recent Mortgage that was taken out on this home.
Original Mortgage
$79,500
Outstanding Balance
$79,365
Interest Rate
6.85%
Mortgage Type
New Conventional
Estimated Equity
$111,423
Purchase Details
Closed on
Dec 1, 2021
Sold by
Huska Jacalyn and Jones Mark R
Bought by
Short Donna L
Home Financials for this Owner
Home Financials are based on the most recent Mortgage that was taken out on this home.
Original Mortgage
$109,463
Interest Rate
3.14%
Mortgage Type
New Conventional
Purchase Details
Closed on
Sep 25, 2012
Sold by
Black Rose N and Novak Frank G
Bought by
Jones Phyllis J
Purchase Details
Closed on
Oct 6, 2004
Sold by
Marjean Lucille Gudgel Trust
Bought by
Black Rose N and Novak Frank G
Purchase Details
Closed on
Dec 8, 2003
Sold by
Mortgage Guaranty Insurance Corp
Bought by
Marjean Lucille Gudgel Trust
Create a Home Valuation Report for This Property
The Home Valuation Report is an in-depth analysis detailing your home's value as well as a comparison with similar homes in the area
Home Values in the Area
Average Home Value in this Area
Purchase History
| Date | Buyer | Sale Price | Title Company |
|---|---|---|---|
| Rudy Richard J | $187,000 | None Listed On Document | |
| Short Donna L | $137,000 | Preferred Settlement Sln | |
| Jones Phyllis J | $107,500 | None Available | |
| Black Rose N | $82,000 | -- | |
| Marjean Lucille Gudgel Trust | $82,000 | -- |
Source: Public Records
Mortgage History
| Date | Status | Borrower | Loan Amount |
|---|---|---|---|
| Open | Rudy Richard J | $79,500 | |
| Previous Owner | Short Donna L | $109,463 |
Source: Public Records
Tax History Compared to Growth
Tax History
| Year | Tax Paid | Tax Assessment Tax Assessment Total Assessment is a certain percentage of the fair market value that is determined by local assessors to be the total taxable value of land and additions on the property. | Land | Improvement |
|---|---|---|---|---|
| 2025 | $1,997 | $16,070 | $2,250 | $13,820 |
| 2024 | $1,997 | $16,070 | $2,250 | $13,820 |
| 2023 | $1,885 | $16,070 | $2,250 | $13,820 |
| 2022 | $1,869 | $16,070 | $2,250 | $13,820 |
| 2021 | $1,869 | $16,070 | $2,250 | $13,820 |
| 2020 | $1,837 | $16,070 | $2,250 | $13,820 |
| 2019 | $1,796 | $16,070 | $2,250 | $13,820 |
| 2018 | $1,716 | $16,070 | $2,250 | $13,820 |
| 2017 | $1,671 | $16,070 | $2,250 | $13,820 |
| 2016 | $1,599 | $16,070 | $2,250 | $13,820 |
| 2015 | $1,599 | $16,070 | $2,250 | $13,820 |
| 2014 | $1,599 | $16,070 | $2,250 | $13,820 |
Source: Public Records
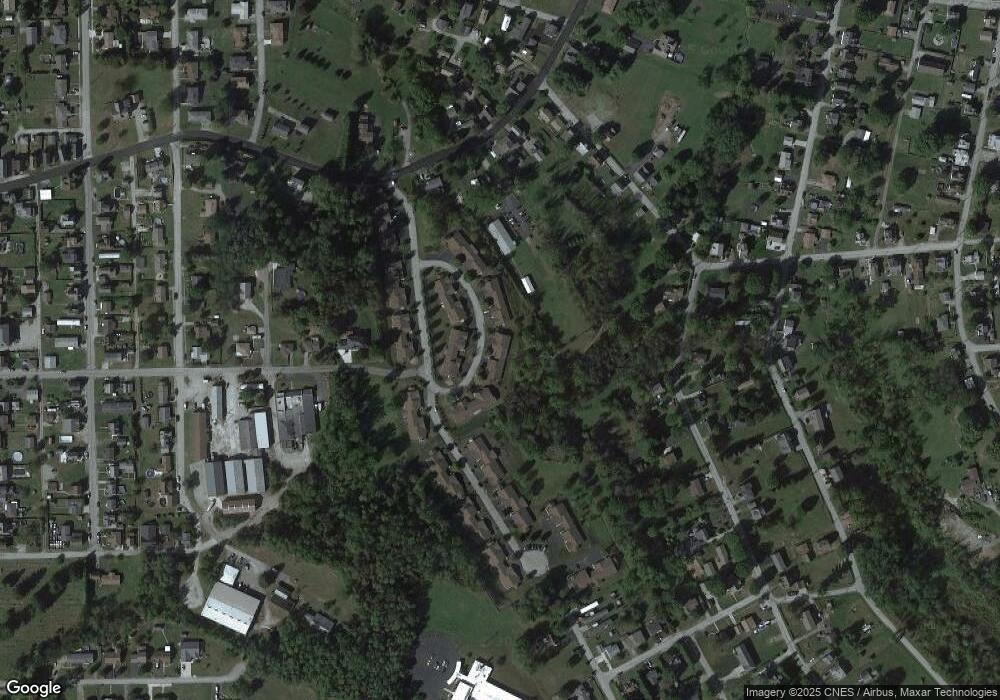
Map
Nearby Homes
- 1306 Spring St
- 1908 Walnut Dr
- 2101 Walnut Dr
- 934 Wood St
- 704 Abbott St
- 1116 Saint Clair St
- 108 Pandora Rd
- 332 Richmond St
- 1 Bankie Dr
- 20 Orchard Dr
- 721 Lehmer St
- 2023 Sylvan Ave
- 701 Fairmont St
- 1710 Raymond Ave
- 1505 Raymond Ave
- 1748 Dailey Ave
- 408 Highview St
- 1607 Ligonier St
- 340 Weldon St
- 700 Hoke St
- 1435 Spring Crest Cir
- 1408 Spring St
- 1425 Spring Crest Cir
- 1482 Spring Crest Cir
- 1469 Spring Crest Cir Unit 1426
- 1432 Spring Crest Cir
- 1453 Spring Crest Cir
- 1423 Spring Crest Cir
- 1506 Timothy Dr
- 1504 Timothy Dr
- 1466 Spring Crest Cir Unit 5A
- 1468 Spring Crest Cir Unit 1418
- 1429 Spring Crest Cir
- 1502 Timothy Dr
- 1455 Spring Crest Cir
- 1433 Spring Crest Cir
- 1459 Spring Crest Cir Unit 1436
- 1437 Spring Crest Cir
- 1316 Spring St
- 1324 Spring St