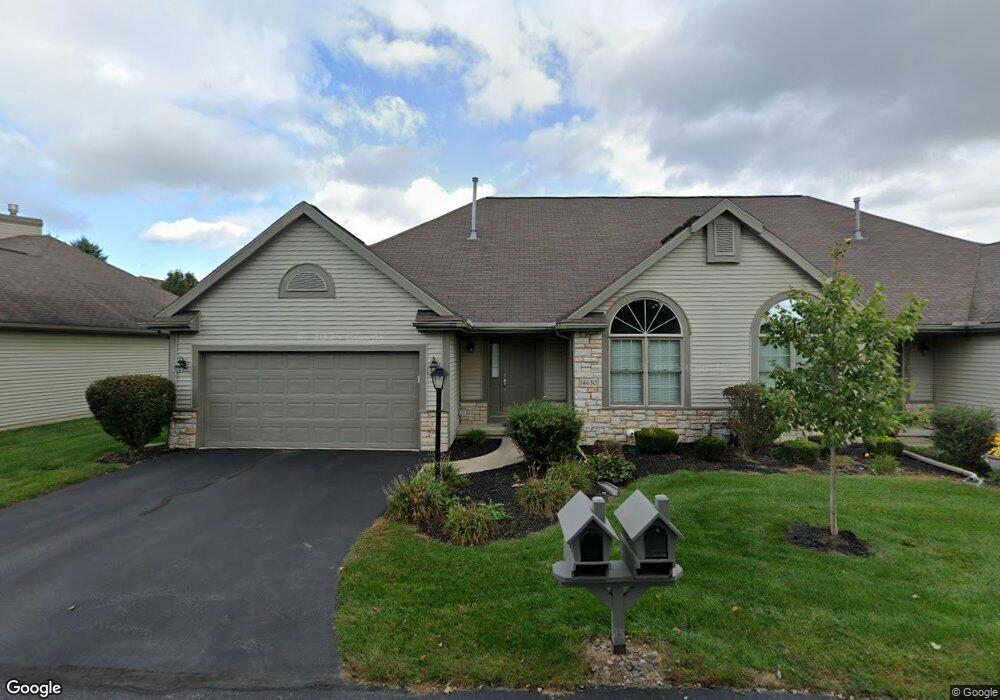
14630 Dexter Falls Rd Unit 3 Perrysburg, OH 43551
Estimated Value: $254,000 - $300,000
2
Beds
2
Baths
1,268
Sq Ft
$211/Sq Ft
Est. Value
About This Home
This home is located at 14630 Dexter Falls Rd Unit 3, Perrysburg, OH 43551 and is currently estimated at $267,198, approximately $210 per square foot. 14630 Dexter Falls Rd Unit 3 is a home located in Wood County with nearby schools including Frank Elementary School, Perrysburg Junior High School, and Perrysburg High School.
Ownership History
Date
Name
Owned For
Owner Type
Purchase Details
Closed on
Sep 20, 2007
Sold by
Drago Joseph C and Polonia Tina M
Bought by
Warnimont Chad
Current Estimated Value
Home Financials for this Owner
Home Financials are based on the most recent Mortgage that was taken out on this home.
Original Mortgage
$70,000
Interest Rate
6.66%
Mortgage Type
Purchase Money Mortgage
Purchase Details
Closed on
Mar 14, 2006
Sold by
Drago Peggy M
Bought by
Drago Peggy and Peggy Drago Trust
Purchase Details
Closed on
Jul 28, 2004
Sold by
Wehrle Development Ltd
Bought by
Drago Peggy M
Home Financials for this Owner
Home Financials are based on the most recent Mortgage that was taken out on this home.
Original Mortgage
$77,000
Interest Rate
6.4%
Mortgage Type
Purchase Money Mortgage
Create a Home Valuation Report for This Property
The Home Valuation Report is an in-depth analysis detailing your home's value as well as a comparison with similar homes in the area
Home Values in the Area
Average Home Value in this Area
Purchase History
| Date | Buyer | Sale Price | Title Company |
|---|---|---|---|
| Warnimont Chad | $162,000 | None Available | |
| Drago Peggy | -- | None Available | |
| Drago Peggy M | $164,000 | Louisville Title |
Source: Public Records
Mortgage History
| Date | Status | Borrower | Loan Amount |
|---|---|---|---|
| Closed | Warnimont Chad | $70,000 | |
| Previous Owner | Drago Peggy M | $77,000 |
Source: Public Records
Tax History Compared to Growth
Tax History
| Year | Tax Paid | Tax Assessment Tax Assessment Total Assessment is a certain percentage of the fair market value that is determined by local assessors to be the total taxable value of land and additions on the property. | Land | Improvement |
|---|---|---|---|---|
| 2024 | $4,892 | $81,900 | $14,000 | $67,900 |
| 2023 | $4,892 | $81,900 | $14,000 | $67,900 |
| 2021 | $4,405 | $67,450 | $12,250 | $55,200 |
| 2020 | $4,391 | $67,450 | $12,250 | $55,200 |
| 2019 | $4,012 | $58,630 | $12,250 | $46,380 |
| 2018 | $3,601 | $58,630 | $12,250 | $46,380 |
| 2017 | $3,549 | $58,630 | $12,250 | $46,380 |
| 2016 | $3,209 | $50,610 | $12,250 | $38,360 |
| 2015 | $3,209 | $50,610 | $12,250 | $38,360 |
| 2014 | $3,203 | $50,020 | $12,250 | $37,770 |
| 2013 | $3,304 | $50,020 | $12,250 | $37,770 |
Source: Public Records
Map
Nearby Homes
- 14701 Dexter Falls Rd
- The Ridgemont Plan at Villages at Canterbury
- The Prestonwood Plan at Villages at Canterbury
- The Lexington Plan at Villages at Canterbury
- The Juniper Plan at Villages at Canterbury
- The Forestview Plan at Villages at Canterbury
- The Canterbury I Plan at Villages at Canterbury
- The Drakefield Plan at Villages at Canterbury
- 116 Old Dover Rd
- 114 Old Dover Rd
- 124 Old Dover Rd
- 130 Old Dover Rd
- 120 Old Dover Rd
- 113 Old Dover Rd
- 115 Old Dover Rd
- LOT 140 Canterbury Blvd
- 113 Wellington Place
- 117 Wellington Place
- 1002 Ellesmere
- 14888 Reddington Ct
- 14644 Dexter Falls Rd Unit 2
- 14624 Dexter Falls Rd Unit 4
- 14633 Dexter Falls Rd Unit 16
- 14625 Dexter Falls Rd Unit 15
- 14620 Dexter Falls Rd Unit 5
- 14650 Dexter Falls Rd Unit 1
- 25310 Ramblehurst Dr
- 25272 Ramblehurst Dr
- 14618 Dexter Falls Rd Unit 6
- 14599 Dexter Falls Rd
- 14597 Dexter Falls Rd Unit 13
- 25262 Ramblehurst Dr
- 25324 Ramblehurst Dr
- 25248 Ramblehurst Dr
- 25338 Ramblehurst Dr
- 14595 Dexter Falls Rd Unit 41
- 14684 Dexter Falls Rd
- 25267 Ramblehurst Dr
- 14576 Dexter Falls Rd Unit 22
- 14571 Dexter Falls Rd Unit 39