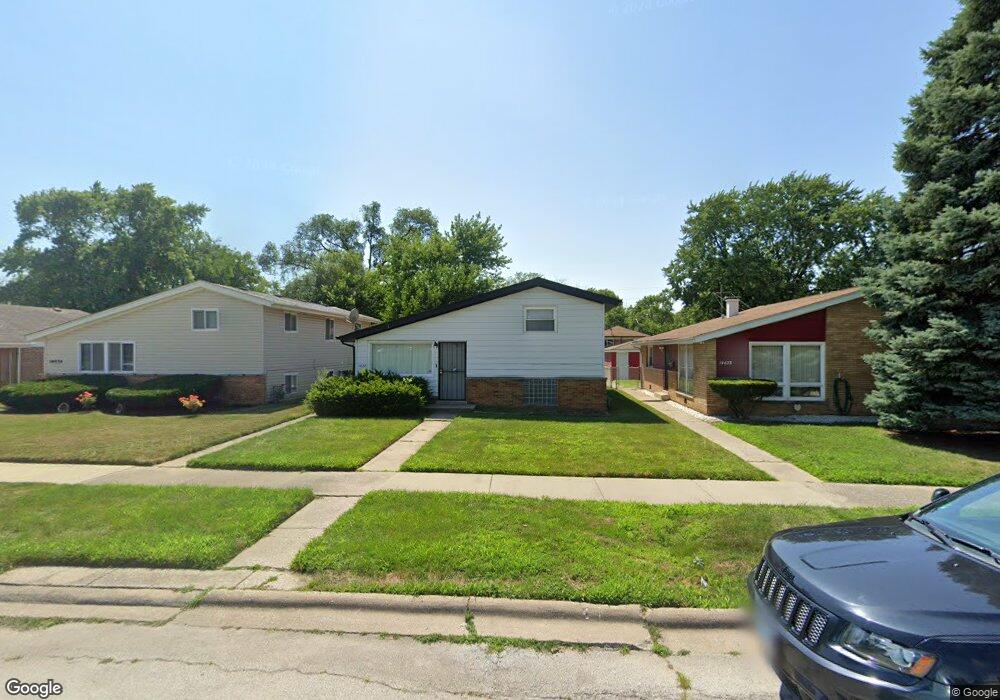
14632 Blackstone Ave Dolton, IL 60419
Estimated Value: $143,000 - $195,000
3
Beds
1
Bath
1,052
Sq Ft
$160/Sq Ft
Est. Value
About This Home
This home is located at 14632 Blackstone Ave, Dolton, IL 60419 and is currently estimated at $168,056, approximately $159 per square foot. 14632 Blackstone Ave is a home located in Cook County with nearby schools including Berger-Vandenberg Elementary School, Creative Communications Academy, and School Of Fine Arts Academy.
Ownership History
Date
Name
Owned For
Owner Type
Purchase Details
Closed on
Sep 22, 2023
Sold by
Sapelo Express Llc
Bought by
Bailey Family Trust and Bailey
Current Estimated Value
Purchase Details
Closed on
Apr 22, 2022
Sold by
Chicago Title Land Trust Company
Bought by
Sapelo Express Llc
Purchase Details
Closed on
Apr 15, 2022
Sold by
Cash Flow Investors Ii Llc
Bought by
Chicago Title Land Trust Co and Trust No 8002388208
Purchase Details
Closed on
Apr 14, 2022
Sold by
Cash Flow Investors Ii Llc
Bought by
Chicago Title Land Trust
Purchase Details
Closed on
Mar 27, 2017
Sold by
Perz Robert R
Bought by
Cash Flow Investors Ii Llc
Home Financials for this Owner
Home Financials are based on the most recent Mortgage that was taken out on this home.
Original Mortgage
$94,500
Interest Rate
4.1%
Mortgage Type
Credit Line Revolving
Create a Home Valuation Report for This Property
The Home Valuation Report is an in-depth analysis detailing your home's value as well as a comparison with similar homes in the area
Home Values in the Area
Average Home Value in this Area
Purchase History
| Date | Buyer | Sale Price | Title Company |
|---|---|---|---|
| Bailey Family Trust | -- | None Listed On Document | |
| Sapelo Express Llc | $140,000 | Chicago Title | |
| Chicago Title Land Trust Co | -- | -- | |
| Chicago Title Land Trust | -- | Chicago Title | |
| Cash Flow Investors Ii Llc | $52,500 | Fidelity National Title |
Source: Public Records
Mortgage History
| Date | Status | Borrower | Loan Amount |
|---|---|---|---|
| Previous Owner | Cash Flow Investors Ii Llc | $94,500 |
Source: Public Records
Tax History Compared to Growth
Tax History
| Year | Tax Paid | Tax Assessment Tax Assessment Total Assessment is a certain percentage of the fair market value that is determined by local assessors to be the total taxable value of land and additions on the property. | Land | Improvement |
|---|---|---|---|---|
| 2024 | $7,335 | $13,000 | $2,091 | $10,909 |
| 2023 | $8,079 | $13,000 | $2,091 | $10,909 |
| 2022 | $8,079 | $11,160 | $1,845 | $9,315 |
| 2021 | $7,686 | $11,160 | $1,845 | $9,315 |
| 2020 | $2,385 | $3,708 | $1,845 | $1,863 |
| 2019 | $6,814 | $9,344 | $1,722 | $7,622 |
| 2018 | $6,785 | $9,344 | $1,722 | $7,622 |
| 2017 | $6,420 | $9,344 | $1,722 | $7,622 |
| 2016 | $2,570 | $9,304 | $1,599 | $7,705 |
| 2015 | $2,608 | $9,304 | $1,599 | $7,705 |
| 2014 | $2,521 | $9,304 | $1,599 | $7,705 |
| 2013 | $2,421 | $8,753 | $1,599 | $7,154 |
Source: Public Records
Map
Nearby Homes
- 14613 Dante Ave
- 1429 Kasten Dr
- 1425 Kasten Dr
- 14737 Blackstone Ave
- 14738 Blackstone Ave
- 14637 Kenwood Ave
- 14516 Harper Ave
- 14634 Kenwood Ave
- 14622 Kenwood Ave
- 14519 Kenwood Ave
- 14728 Kenwood Ave
- 14808 Dorchester Ave
- 14441 Dante Ave
- 301 Cornell Ave
- 14737 Kimbark Ave
- 14428 Dante Ave
- 14417 Dorchester Ave
- 294 Madison Ave
- 14700 Avalon Ave
- 363 Prairie Ave
- 14634 Blackstone Ave
- 14628 Blackstone Ave
- 14638 Blackstone Ave
- 14626 Blackstone Ave
- 14642 Blackstone Ave
- 14622 Blackstone Ave
- 14635 Dante Ave
- 14637 Dante Ave
- 14631 Dante Ave
- 14618 Blackstone Ave
- 14644 Blackstone Ave
- 14641 Dante Ave
- 14627 Dante Ave
- 14643 Dante Ave
- 14623 Dante Ave
- 14616 Blackstone Ave
- 14621 Dante Ave
- 14645 Dante Ave
- 14612 Blackstone Ave
- 14617 Dante Ave