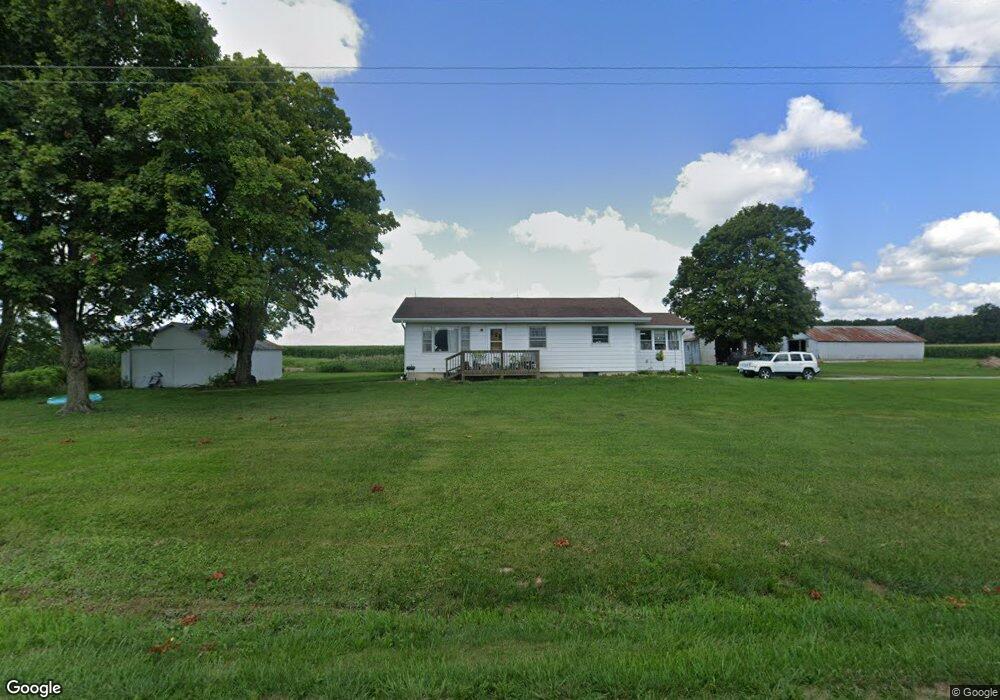
14633 N 800th St Effingham, IL 62401
Estimated Value: $204,000 - $294,000
2
Beds
1
Bath
988
Sq Ft
$246/Sq Ft
Est. Value
About This Home
This home is located at 14633 N 800th St, Effingham, IL 62401 and is currently estimated at $242,854, approximately $245 per square foot. 14633 N 800th St is a home located in Effingham County with nearby schools including Beecher City Grade School and Beecher City Junior/Senior High School.
Ownership History
Date
Name
Owned For
Owner Type
Purchase Details
Closed on
May 31, 2013
Sold by
Burke Ronald L and Burke Nancy
Bought by
Miller Gary L and Miller Minda L
Current Estimated Value
Home Financials for this Owner
Home Financials are based on the most recent Mortgage that was taken out on this home.
Original Mortgage
$77,500
Interest Rate
4.18%
Mortgage Type
Unknown
Purchase Details
Closed on
Dec 15, 2011
Sold by
Burke Ronald L and Burke Beverly J
Bought by
Burke Ronald L and Burke Nancy
Purchase Details
Closed on
Dec 5, 2008
Sold by
Scott Charlotte
Bought by
Burke Ronald L and Burke Nancy L
Home Financials for this Owner
Home Financials are based on the most recent Mortgage that was taken out on this home.
Original Mortgage
$110,000
Interest Rate
6.5%
Mortgage Type
Future Advance Clause Open End Mortgage
Create a Home Valuation Report for This Property
The Home Valuation Report is an in-depth analysis detailing your home's value as well as a comparison with similar homes in the area
Home Values in the Area
Average Home Value in this Area
Purchase History
| Date | Buyer | Sale Price | Title Company |
|---|---|---|---|
| Miller Gary L | $152,500 | None Available | |
| Burke Ronald L | -- | None Available | |
| Burke Ronald L | $105,000 | None Available |
Source: Public Records
Mortgage History
| Date | Status | Borrower | Loan Amount |
|---|---|---|---|
| Closed | Miller Gary L | $77,500 | |
| Previous Owner | Burke Ronald L | $110,000 |
Source: Public Records
Tax History Compared to Growth
Tax History
| Year | Tax Paid | Tax Assessment Tax Assessment Total Assessment is a certain percentage of the fair market value that is determined by local assessors to be the total taxable value of land and additions on the property. | Land | Improvement |
|---|---|---|---|---|
| 2024 | $1,995 | $42,480 | $4,790 | $37,690 |
| 2023 | $1,828 | $38,350 | $4,240 | $34,110 |
| 2022 | $1,741 | $35,360 | $3,780 | $31,580 |
| 2021 | $1,634 | $33,490 | $3,410 | $30,080 |
| 2020 | $1,566 | $32,010 | $3,090 | $28,920 |
| 2019 | $1,515 | $30,880 | $2,800 | $28,080 |
| 2018 | $1,424 | $29,260 | $2,520 | $26,740 |
| 2017 | $1,376 | $28,520 | $2,300 | $26,220 |
| 2016 | $1,306 | $27,140 | $2,050 | $25,090 |
| 2015 | -- | $26,710 | $1,870 | $24,840 |
| 2014 | -- | $26,340 | $1,750 | $24,590 |
| 2013 | -- | $27,360 | $1,730 | $25,630 |
| 2012 | -- | $27,340 | $1,710 | $25,630 |
Source: Public Records
Map
Nearby Homes
- 8404 E Twin Oaks Dr
- 8242 E Twin Oaks Dr
- 13969 N 850th St
- 8774 E Chinquapin Ave
- 14915 N 8th Ave
- 15325 N Cardinal Ln
- 9284 E Court 11
- 9219 E Best Ct
- 15095 N Nees Ln
- 14744 N Court 1
- 14704 N Court 1
- 15772 N Lakeview Dr
- LOT 5 Pineridge Rd
- 10028 Pineridge Rd
- 14801 N Park Rd
- 14480 N 1025th St
- 14677 N Kepley Ln
- 24 N Country Club Rd
- 38 N Country Club Rd
- 13120 Augusta National Dr
- 14534 N 800th St
- 14830 N 800th St
- 14854 N 800th St
- 8069 E Twin Oaks Dr
- 8274 E 1450th Ave
- 8247 E 1450th Ave
- 8155 E Twin Oaks Dr
- 7777 E 1500th Ave
- 8124 E Twin Oaks Dr
- 8201 E Twin Oaks Dr
- 7799 E 1500th Ave
- 14656 N South Shore Dr
- 7773 E 1500th Ave
- #2 Twin Oaks Dr
- #1 Twin Oaks Dr
- Lot 14 Twin Oaks Dr
- 3 Twin Oaks Dr
- 8416 E Twin Oaks Dr
- 8774 E Twin Oaks Dr
- 15010 E Townhall Rd