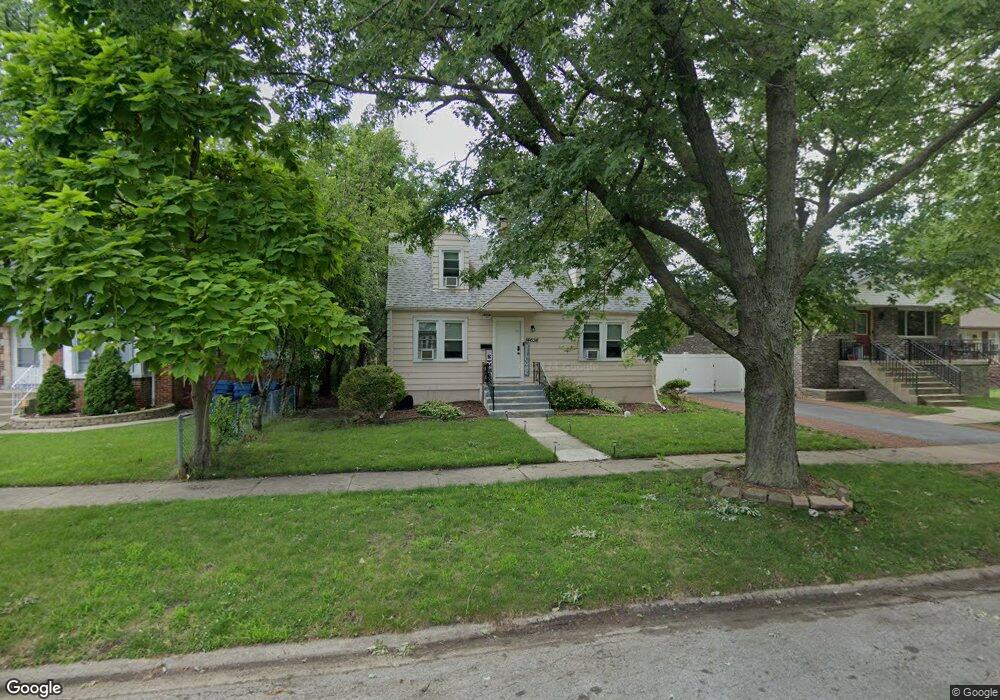
14636 Trumbull Ave Midlothian, IL 60445
Estimated Value: $189,826 - $1,499,000
3
Beds
2
Baths
1,122
Sq Ft
$468/Sq Ft
Est. Value
About This Home
This home is located at 14636 Trumbull Ave, Midlothian, IL 60445 and is currently estimated at $524,957, approximately $467 per square foot. 14636 Trumbull Ave is a home located in Cook County with nearby schools including Springfield Elementary School, Bremen High School, and St Christopher School.
Ownership History
Date
Name
Owned For
Owner Type
Purchase Details
Closed on
Jul 28, 2015
Sold by
Bltrejv3 Chicago Llc
Bought by
Csma Blt Llc
Current Estimated Value
Purchase Details
Closed on
Dec 19, 2012
Sold by
Cso Opp Iii Llc
Bought by
Bltrejv3 Chicago Llc
Purchase Details
Closed on
Mar 30, 2011
Sold by
Gcp Real Estate Inc
Bought by
Restoration Asset Management Llc
Purchase Details
Closed on
Mar 25, 2011
Sold by
Restoration Asset Management Llc
Bought by
Cso Opp Iii Llc
Purchase Details
Closed on
Dec 15, 2010
Sold by
Gcp Real Estate Inc
Bought by
First Midwest Bank
Purchase Details
Closed on
Dec 3, 2007
Sold by
Pappas Gregory C
Bought by
Gcp Real Estate Inc
Purchase Details
Closed on
Jun 2, 2006
Sold by
Lynch James F and Lynch Patricia
Bought by
Pappas Gregory C
Home Financials for this Owner
Home Financials are based on the most recent Mortgage that was taken out on this home.
Original Mortgage
$140,000
Interest Rate
6.66%
Mortgage Type
Fannie Mae Freddie Mac
Create a Home Valuation Report for This Property
The Home Valuation Report is an in-depth analysis detailing your home's value as well as a comparison with similar homes in the area
Home Values in the Area
Average Home Value in this Area
Purchase History
| Date | Buyer | Sale Price | Title Company |
|---|---|---|---|
| Csma Blt Llc | $1,128,500 | Attorney | |
| Bltrejv3 Chicago Llc | $40,000 | None Available | |
| Restoration Asset Management Llc | -- | Cti | |
| Cso Opp Iii Llc | $58,000 | Cti | |
| First Midwest Bank | $475,000 | None Available | |
| Gcp Real Estate Inc | -- | Pntn | |
| Pappas Gregory C | $175,000 | Cti |
Source: Public Records
Mortgage History
| Date | Status | Borrower | Loan Amount |
|---|---|---|---|
| Previous Owner | Pappas Gregory C | $140,000 |
Source: Public Records
Tax History
| Year | Tax Paid | Tax Assessment Tax Assessment Total Assessment is a certain percentage of the fair market value that is determined by local assessors to be the total taxable value of land and additions on the property. | Land | Improvement |
|---|---|---|---|---|
| 2025 | $5,025 | $13,280 | $2,328 | $10,952 |
| 2024 | $5,025 | $13,280 | $2,328 | $10,952 |
| 2023 | $5,028 | $13,280 | $2,328 | $10,952 |
| 2022 | $5,028 | $10,702 | $1,995 | $8,707 |
| 2021 | $4,834 | $10,702 | $1,995 | $8,707 |
| 2020 | $4,604 | $10,702 | $1,995 | $8,707 |
| 2019 | $3,927 | $9,042 | $1,828 | $7,214 |
| 2018 | $3,865 | $9,042 | $1,828 | $7,214 |
| 2017 | $4,382 | $10,636 | $1,828 | $8,808 |
| 2016 | $4,015 | $9,359 | $1,662 | $7,697 |
| 2015 | $3,926 | $9,359 | $1,662 | $7,697 |
| 2014 | $3,810 | $9,359 | $1,662 | $7,697 |
| 2013 | $3,600 | $9,841 | $1,662 | $8,179 |
Source: Public Records
Map
Nearby Homes
- 3625 147th St
- 3618 148th St
- 3642 147th Place
- 14832 Clifton Park Ave
- 14503 Waverly Ave
- 14301 Hamlin Ave
- 14328 Lawndale Ave
- 3206 Kinne Rd
- 15031 Hamlin Ave
- 14925 Whipple Ave
- 14539 Crawford Ave
- 15112 Ridgeway Ave
- 14544 S San Francisco Ave
- 14044 S Grace Ave
- 3902 Claire Blvd
- 14547 Keystone Ave Unit 12
- 14613 Keystone Ave
- 2918 143rd Place
- 14828 S San Francisco Ave
- 3127 141st Place
- 14632 Trumbull Ave
- 14644 Trumbull Ave
- 14626 Trumbull Ave
- 14633 Saint Louis Ave
- 14643 Saint Louis Ave
- 3434 147th St
- 14627 Saint Louis Ave
- 14637 Trumbull Ave
- 14616 Trumbull Ave
- 14623 Saint Louis Ave
- 14633 Trumbull Ave Unit 5109
- 14643 Trumbull Ave
- 14627 Trumbull Ave
- 14655 Saint Louis Ave
- 14617 Saint Louis Ave
- 14623 Trumbull Ave
- 14612 Trumbull Ave
- 14613 Saint Louis Ave
- 14606 Trumbull Ave
- 14611 Trumbull Ave
Your Personal Tour Guide
Ask me questions while you tour the home.