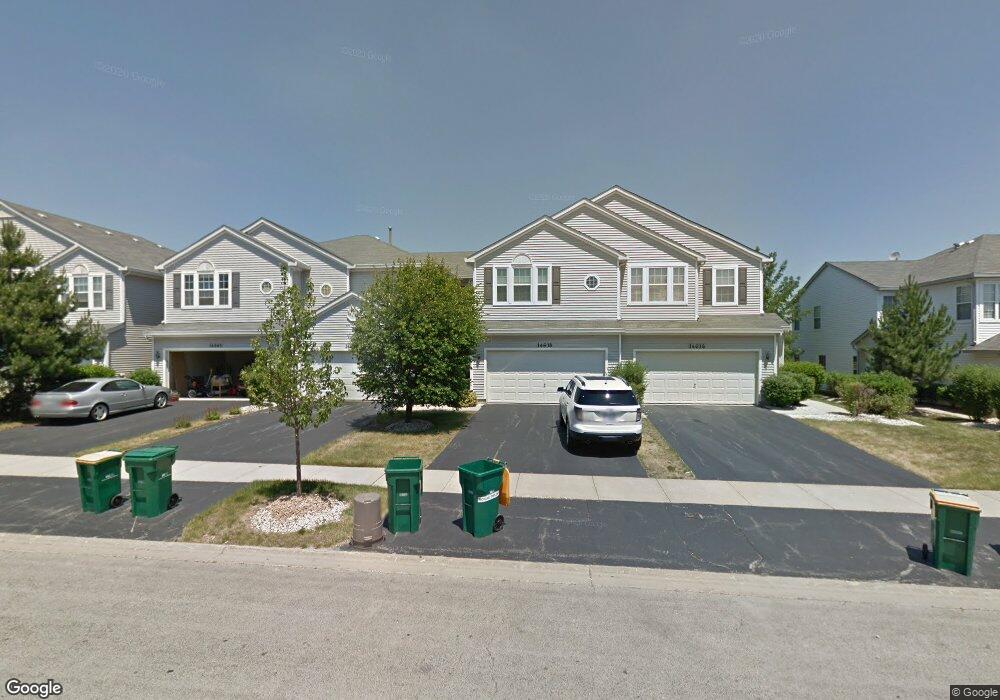
14638 Aston Way Unit T1845 Lockport, IL 60441
South Homer Glen NeighborhoodEstimated Value: $297,628 - $335,000
--
Bed
--
Bath
1,665
Sq Ft
$195/Sq Ft
Est. Value
About This Home
This home is located at 14638 Aston Way Unit T1845, Lockport, IL 60441 and is currently estimated at $324,657, approximately $194 per square foot. 14638 Aston Way Unit T1845 is a home located in Will County with nearby schools including William E Young School, Hadley Middle School, and Homer Jr High School.
Ownership History
Date
Name
Owned For
Owner Type
Purchase Details
Closed on
Jun 20, 2020
Sold by
Anderson James R and Anderson Corey B
Bought by
Anderson James R
Current Estimated Value
Home Financials for this Owner
Home Financials are based on the most recent Mortgage that was taken out on this home.
Original Mortgage
$146,469
Interest Rate
2.9%
Mortgage Type
New Conventional
Purchase Details
Closed on
Oct 22, 2007
Sold by
Anderson James R and Anderson Corey B
Bought by
Anderson James R and Anderson Corey B
Purchase Details
Closed on
Apr 3, 2003
Sold by
Montalbano Builders Inc
Bought by
Anderson James R
Home Financials for this Owner
Home Financials are based on the most recent Mortgage that was taken out on this home.
Original Mortgage
$101,000
Interest Rate
5.94%
Mortgage Type
Purchase Money Mortgage
Create a Home Valuation Report for This Property
The Home Valuation Report is an in-depth analysis detailing your home's value as well as a comparison with similar homes in the area
Home Values in the Area
Average Home Value in this Area
Purchase History
| Date | Buyer | Sale Price | Title Company |
|---|---|---|---|
| Anderson James R | -- | Attorney | |
| Anderson James R | -- | None Available | |
| Anderson James R | $173,500 | First American Title |
Source: Public Records
Mortgage History
| Date | Status | Borrower | Loan Amount |
|---|---|---|---|
| Previous Owner | Anderson James R | $146,469 | |
| Previous Owner | Anderson James R | $101,000 |
Source: Public Records
Tax History Compared to Growth
Tax History
| Year | Tax Paid | Tax Assessment Tax Assessment Total Assessment is a certain percentage of the fair market value that is determined by local assessors to be the total taxable value of land and additions on the property. | Land | Improvement |
|---|---|---|---|---|
| 2024 | $6,948 | $87,784 | $12,038 | $75,746 |
| 2023 | $6,948 | $79,572 | $10,912 | $68,660 |
| 2022 | $6,394 | $74,297 | $10,189 | $64,108 |
| 2021 | $6,091 | $70,390 | $9,653 | $60,737 |
| 2020 | $6,058 | $67,800 | $9,298 | $58,502 |
| 2019 | $5,871 | $65,224 | $8,945 | $56,279 |
| 2018 | $5,695 | $62,856 | $8,842 | $54,014 |
| 2017 | $5,589 | $61,096 | $8,594 | $52,502 |
| 2016 | $5,457 | $59,058 | $8,307 | $50,751 |
| 2015 | $5,185 | $56,841 | $7,995 | $48,846 |
| 2014 | $5,185 | $54,661 | $7,830 | $46,831 |
| 2013 | $5,185 | $54,661 | $7,830 | $46,831 |
Source: Public Records
Map
Nearby Homes
- 14443 Etchingham Dr
- 14414 W 167th St
- 16601 S Windsor Ln Unit T1611
- 16663 S Windsor Ln Unit T1644
- 14549 W 159th St
- 16340 S Alberta Ct
- 0B W 159th St
- 15053 Sagebrush Ln Unit 1254
- 16515 S Farmington Ln
- 15326 W Harvest Ln
- 16001 S Leach Dr Unit 3
- 1,2 W Rambling Rd
- 0 NW 159th Parker St Unit MRD12445910
- 16609 S Silo Bend Dr
- 14858 W Glen Crest Ln
- 16604 Pine Hill Dr
- 16860 S Ivy Ln
- 15100 W 159th St
- 0 W 159th St
- 12362 W 159th St
- 14640 Aston Way Unit T1844
- 14636 Aston Way Unit T1846
- 14642 Aston Way Unit T1843
- 14646 Aston Way Unit T1841
- 14644 Aston Way Unit T1842
- 14650 Aston Way Unit T1834
- 14652 Aston Way Unit T1833
- 14654 Aston Way Unit T1832
- 14648 Aston Way Unit T1835
- 14626 Aston Way Unit T1855
- 14626 Aston Way Unit 14626
- 14643 Aston Way Unit T1873
- 14639 Aston Way Unit T1875
- 14639 Aston Way Unit 14639
- 14645 Aston Way Unit T1872
- 14637 Aston Way Unit T1876
- 14628 Aston Way Unit T1854
- 14630 Aston Way Unit T1853
- 14632 Aston Way Unit 1852
- 14634 Aston Way