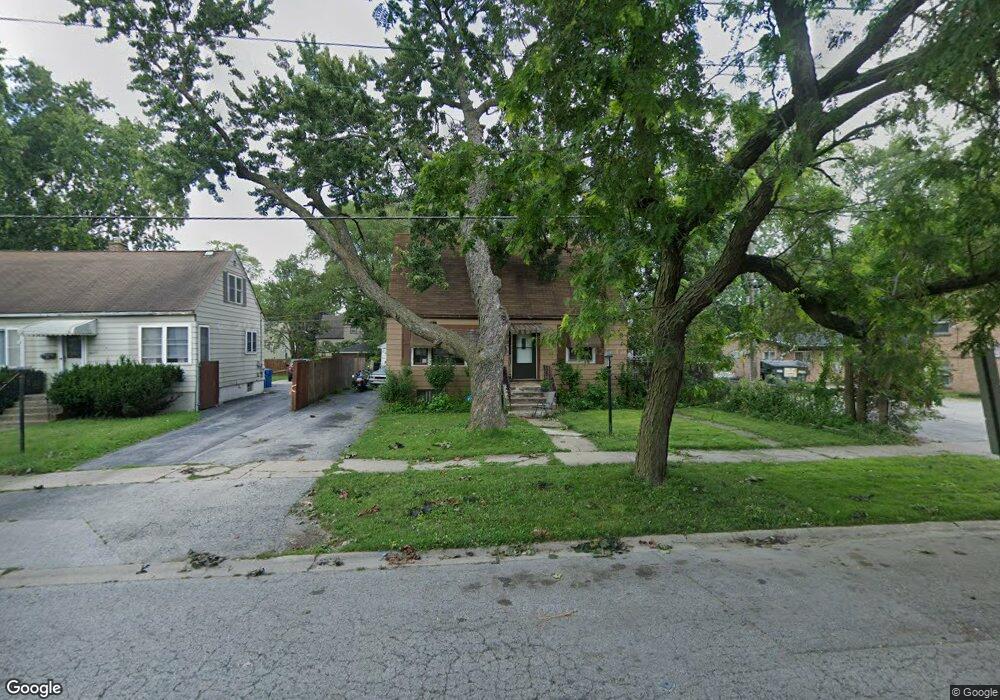
14643 Central Park Ave Midlothian, IL 60445
Estimated Value: $209,000 - $231,000
3
Beds
1
Bath
1,116
Sq Ft
$194/Sq Ft
Est. Value
About This Home
This home is located at 14643 Central Park Ave, Midlothian, IL 60445 and is currently estimated at $216,522, approximately $194 per square foot. 14643 Central Park Ave is a home located in Cook County with nearby schools including Springfield Elementary School, Bremen High School, and St Christopher School.
Ownership History
Date
Name
Owned For
Owner Type
Purchase Details
Closed on
Mar 29, 2011
Sold by
Kavvadas Demetrious
Bought by
Marquette Bank and Trust #19524
Current Estimated Value
Purchase Details
Closed on
Jan 3, 2010
Sold by
Kavvadas Peter A
Bought by
Kavvadas Demetrious
Purchase Details
Closed on
Jun 18, 2002
Sold by
Kavvadas Demetrios and Kavvadas Stamo
Bought by
Kavvadas Peter A
Home Financials for this Owner
Home Financials are based on the most recent Mortgage that was taken out on this home.
Original Mortgage
$65,000
Interest Rate
6.87%
Purchase Details
Closed on
Nov 29, 1999
Sold by
Gifford Kevin W and Gifford Elizabeth S
Bought by
Kavvadas Demetrios and Kavvadas Stamo
Home Financials for this Owner
Home Financials are based on the most recent Mortgage that was taken out on this home.
Original Mortgage
$79,300
Interest Rate
7.81%
Mortgage Type
FHA
Create a Home Valuation Report for This Property
The Home Valuation Report is an in-depth analysis detailing your home's value as well as a comparison with similar homes in the area
Home Values in the Area
Average Home Value in this Area
Purchase History
| Date | Buyer | Sale Price | Title Company |
|---|---|---|---|
| Marquette Bank | -- | None Available | |
| Kavvadas Demetrious | -- | None Available | |
| Kavvadas Peter A | $95,000 | Ticor Title | |
| Kavvadas Demetrios | $97,000 | -- |
Source: Public Records
Mortgage History
| Date | Status | Borrower | Loan Amount |
|---|---|---|---|
| Previous Owner | Kavvadas Peter A | $65,000 | |
| Previous Owner | Kavvadas Demetrios | $79,300 |
Source: Public Records
Tax History
| Year | Tax Paid | Tax Assessment Tax Assessment Total Assessment is a certain percentage of the fair market value that is determined by local assessors to be the total taxable value of land and additions on the property. | Land | Improvement |
|---|---|---|---|---|
| 2025 | $3,418 | $15,000 | $2,587 | $12,413 |
| 2024 | $3,418 | $15,000 | $2,587 | $12,413 |
| 2023 | $2,932 | $15,000 | $2,587 | $12,413 |
| 2022 | $2,932 | $12,398 | $2,218 | $10,180 |
| 2021 | $1,651 | $12,397 | $2,217 | $10,180 |
| 2020 | $1,465 | $12,397 | $2,217 | $10,180 |
| 2019 | $1,635 | $13,133 | $2,032 | $11,101 |
| 2018 | $1,612 | $13,133 | $2,032 | $11,101 |
| 2017 | $1,526 | $13,133 | $2,032 | $11,101 |
| 2016 | $2,598 | $10,858 | $1,848 | $9,010 |
| 2015 | $2,668 | $10,858 | $1,848 | $9,010 |
| 2014 | $2,628 | $10,858 | $1,848 | $9,010 |
| 2013 | $2,867 | $12,346 | $1,848 | $10,498 |
Source: Public Records
Map
Nearby Homes
- 3625 147th St
- 14503 Waverly Ave
- 14839 Lawndale Ave
- 14301 Hamlin Ave
- 14430 Ridgeway Ave
- 14820 Turner Ave
- 14328 Lawndale Ave
- 14539 Crawford Ave
- 15031 Hamlin Ave
- 14613 Keystone Ave
- 4031 147th St
- 14401 Pulaski Rd
- 14618 Keystone Ave
- 3902 Claire Blvd
- 15112 Ridgeway Ave
- 15035 Harding Ave
- 14903 Terrace Ln
- 14837 Karlov Ave
- 15115 Springfield Ave
- 14970 Pulaski Rd Unit 5
- 14637 Central Park Ave
- 14633 Central Park Ave
- 3552 147th St Unit 2
- 3552 147th St Unit 1
- 3552 147th St
- 3552 147th St Unit 3
- 3546 147th St Unit 8
- 3546 147th St Unit 1
- 3546 147th St Unit 5
- 3546 147th St Unit 4
- 14644 Clifton Park Ave
- 14638 Clifton Park Ave
- 14627 Central Park Ave
- 14632 Clifton Park Ave
- 3602 147th St
- 3602 147th St
- 14644 Central Park Ave
- 14626 Clifton Park Ave
- 14638 Central Park Ave
Your Personal Tour Guide
Ask me questions while you tour the home.