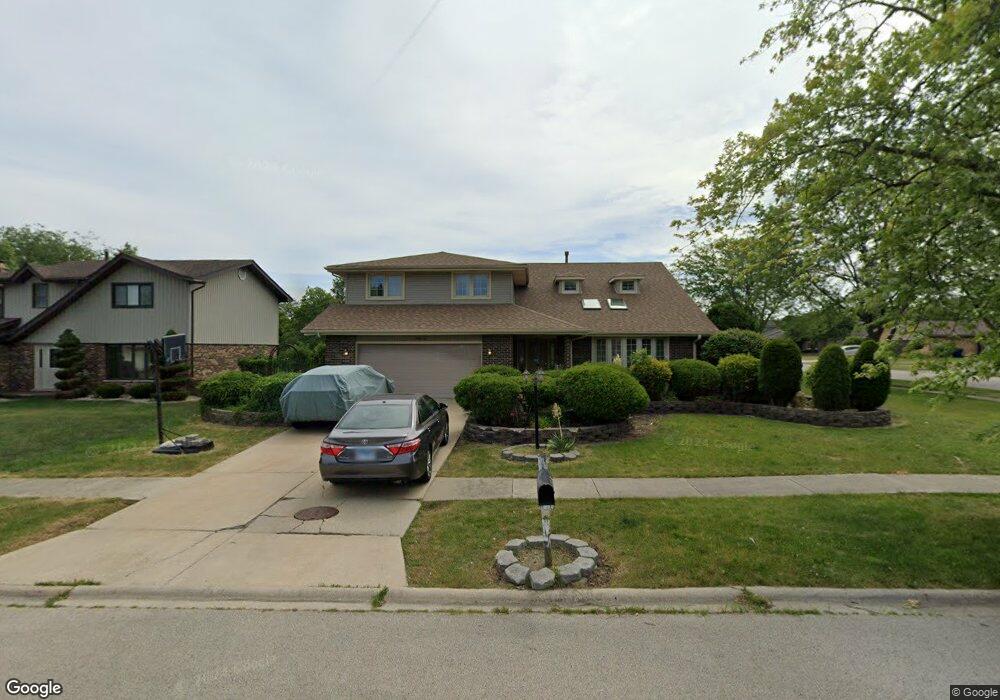
14643 S Bridle Ct Unit 4B Homer Glen, IL 60491
Estimated Value: $506,000 - $548,000
4
Beds
5
Baths
3,211
Sq Ft
$161/Sq Ft
Est. Value
About This Home
This home is located at 14643 S Bridle Ct Unit 4B, Homer Glen, IL 60491 and is currently estimated at $517,670, approximately $161 per square foot. 14643 S Bridle Ct Unit 4B is a home located in Will County with nearby schools including Goodings Grove School, Hadley Middle School, and Homer Jr High School.
Ownership History
Date
Name
Owned For
Owner Type
Purchase Details
Closed on
Aug 2, 2023
Sold by
Zahdan Hazem
Bought by
Zahdan Hazem and Elian Jamil
Current Estimated Value
Purchase Details
Closed on
Oct 18, 2011
Sold by
Elayan Jamil M and Elian Tahany
Bought by
Zahdan Hazem
Home Financials for this Owner
Home Financials are based on the most recent Mortgage that was taken out on this home.
Original Mortgage
$163,500
Interest Rate
4.12%
Mortgage Type
New Conventional
Purchase Details
Closed on
Oct 28, 1999
Sold by
Ryan Timothy J and Ryan Cathleen A
Bought by
Elian Jamil M and Elian Tahany
Home Financials for this Owner
Home Financials are based on the most recent Mortgage that was taken out on this home.
Original Mortgage
$110,000
Interest Rate
7.78%
Mortgage Type
Stand Alone First
Create a Home Valuation Report for This Property
The Home Valuation Report is an in-depth analysis detailing your home's value as well as a comparison with similar homes in the area
Home Values in the Area
Average Home Value in this Area
Purchase History
| Date | Buyer | Sale Price | Title Company |
|---|---|---|---|
| Zahdan Hazem | -- | None Listed On Document | |
| Zahdan Hazem | $218,000 | None Available | |
| Elian Jamil M | $210,000 | -- |
Source: Public Records
Mortgage History
| Date | Status | Borrower | Loan Amount |
|---|---|---|---|
| Previous Owner | Zahdan Hazem | $163,500 | |
| Previous Owner | Elian Jamil M | $110,000 |
Source: Public Records
Tax History Compared to Growth
Tax History
| Year | Tax Paid | Tax Assessment Tax Assessment Total Assessment is a certain percentage of the fair market value that is determined by local assessors to be the total taxable value of land and additions on the property. | Land | Improvement |
|---|---|---|---|---|
| 2024 | $11,281 | $155,383 | $21,398 | $133,985 |
| 2023 | $11,281 | $140,847 | $19,396 | $121,451 |
| 2022 | $9,779 | $131,510 | $18,110 | $113,400 |
| 2021 | $9,313 | $124,595 | $17,158 | $107,437 |
| 2020 | $9,343 | $120,011 | $16,527 | $103,484 |
| 2019 | $8,903 | $115,451 | $15,899 | $99,552 |
| 2018 | $8,426 | $108,370 | $15,717 | $92,653 |
| 2017 | $8,272 | $105,336 | $15,277 | $90,059 |
| 2016 | $8,070 | $101,824 | $14,768 | $87,056 |
| 2015 | $7,737 | $98,002 | $14,214 | $83,788 |
| 2014 | $7,737 | $95,977 | $13,920 | $82,057 |
| 2013 | $7,737 | $95,977 | $13,920 | $82,057 |
Source: Public Records
Map
Nearby Homes
- 14561 S Appaloosa Ln
- 14542 S Mustang Dr
- 14748 S Carlton Ln
- 14541 S Bell Rd
- 14453 S Bell Rd
- 14325 S Bell Rd
- 12459 Rosewood Dr Unit 1
- 14715 S Woodcrest Ave
- Fremont Plan at Kingston Hills
- Briarcliffe Plan at Kingston Hills
- Danbury Plan at Kingston Hills
- Calysta Plan at Kingston Hills
- Eden Plan at Kingston Hills
- Amberwood Plan at Kingston Hills
- 12222 Rambling Rd
- 15022 S Woodcrest Ave Unit 3
- Fremont Plan at Goodings Grove
- Eden Plan at Goodings Grove
- Danbury Plan at Goodings Grove
- Calysta Plan at Goodings Grove
- 14635 S Bridle Ct
- 14644 S Appaloosa Ln
- 14636 S Appaloosa Ln
- 14627 S Bridle Ct
- 12647 W Martingale Ln
- 12639 W Martingale Ln
- 14644 S Bridle Ct
- 14628 S Appaloosa Ln
- 12655 W Martingale Ln
- 14636 S Bridle Ct
- 12631 W Martingale Ln
- 14619 S Bridle Ct
- 14628 S Bridle Ct
- 12663 W Martingale Ln
- 12623 W Martingale Ln
- 14620 S Appaloosa Ln
- 14620 S Bridle Ct
- 14641 S Mustang Dr
- 12554 W Moorland Dr
- 12560 W Moorland Dr