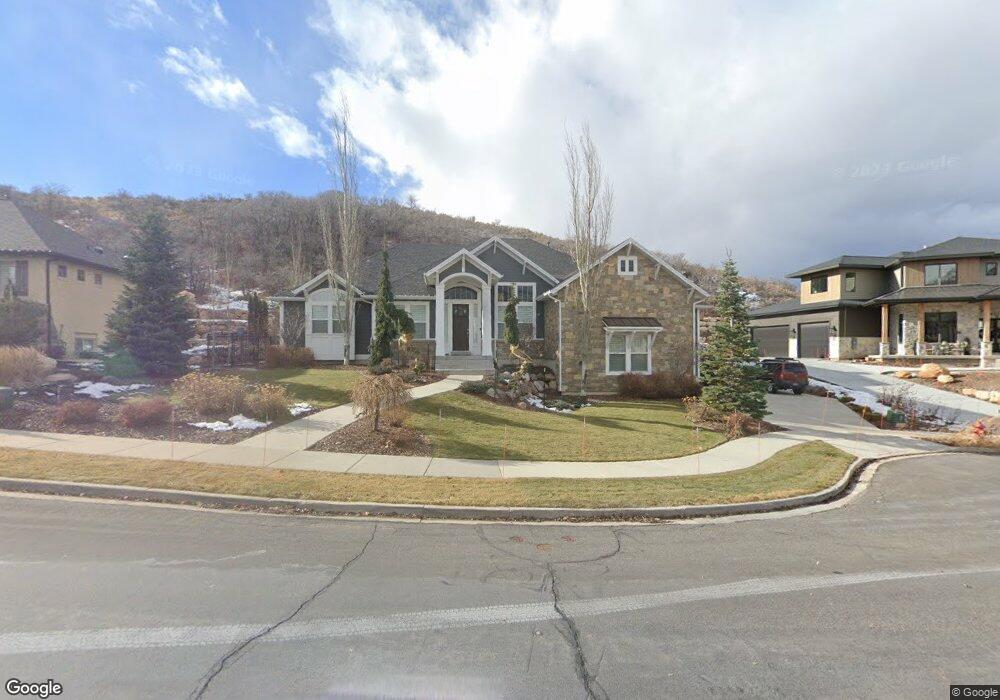
14646 S Woods Landing Ct Draper, UT 84020
Estimated Value: $1,376,000 - $1,606,347
5
Beds
4
Baths
5,013
Sq Ft
$291/Sq Ft
Est. Value
About This Home
This home is located at 14646 S Woods Landing Ct, Draper, UT 84020 and is currently estimated at $1,459,087, approximately $291 per square foot. 14646 S Woods Landing Ct is a home located in Salt Lake County with nearby schools including Oak Hollow School, Draper Park Middle School, and Corner Canyon High School.
Ownership History
Date
Name
Owned For
Owner Type
Purchase Details
Closed on
Aug 29, 2019
Sold by
Patterson Casey and Patterson Kristy
Bought by
Wilkey Julie L and Wilkey Mark
Current Estimated Value
Purchase Details
Closed on
Jun 3, 2013
Sold by
Rainey Homes Inc
Bought by
Patterson Casey and Patterson Kristy
Home Financials for this Owner
Home Financials are based on the most recent Mortgage that was taken out on this home.
Original Mortgage
$570,096
Interest Rate
3.37%
Mortgage Type
New Conventional
Purchase Details
Closed on
Nov 26, 2012
Sold by
Jmr Holdings Llc
Bought by
Rainey Homes Inc
Home Financials for this Owner
Home Financials are based on the most recent Mortgage that was taken out on this home.
Original Mortgage
$428,750
Interest Rate
3.34%
Mortgage Type
Future Advance Clause Open End Mortgage
Create a Home Valuation Report for This Property
The Home Valuation Report is an in-depth analysis detailing your home's value as well as a comparison with similar homes in the area
Home Values in the Area
Average Home Value in this Area
Purchase History
| Date | Buyer | Sale Price | Title Company |
|---|---|---|---|
| Wilkey Julie L | -- | Stewart Title Ins Agcy Of Ut | |
| Patterson Casey | -- | Bonneville Superior Title | |
| Rainey Homes Inc | -- | None Available |
Source: Public Records
Mortgage History
| Date | Status | Borrower | Loan Amount |
|---|---|---|---|
| Previous Owner | Patterson Casey | $570,096 | |
| Previous Owner | Rainey Homes Inc | $428,750 |
Source: Public Records
Tax History Compared to Growth
Tax History
| Year | Tax Paid | Tax Assessment Tax Assessment Total Assessment is a certain percentage of the fair market value that is determined by local assessors to be the total taxable value of land and additions on the property. | Land | Improvement |
|---|---|---|---|---|
| 2025 | $6,440 | $1,295,300 | $386,400 | $908,900 |
| 2024 | $6,440 | $1,230,200 | $363,900 | $866,300 |
| 2023 | $6,378 | $1,209,500 | $328,400 | $881,100 |
| 2022 | $6,067 | $1,111,200 | $322,000 | $789,200 |
| 2021 | $5,811 | $909,200 | $241,500 | $667,700 |
| 2020 | $1,439 | $799,900 | $196,500 | $603,400 |
| 2019 | $4,929 | $714,300 | $183,700 | $530,600 |
| 2018 | $4,460 | $660,500 | $175,600 | $484,900 |
| 2017 | $4,266 | $605,300 | $175,600 | $429,700 |
| 2016 | $4,348 | $599,500 | $124,100 | $475,400 |
| 2015 | $3,523 | $449,800 | $99,400 | $350,400 |
| 2014 | $3,729 | $465,100 | $135,500 | $329,600 |
Source: Public Records
Map
Nearby Homes
- 14678 S Woods Landing Ct
- 14708 S Woods Landing Ct
- 14738 S Woods Landing Ct
- 14849 S Saddle Leaf Ct
- 1945 E Seven Oaks Ln
- 14848 S Seven Oaks Ln
- 14902 S Saddle Leaf Ct
- 14820 S Shadow Grove Ct
- 14781 S Glamis Ct
- 14234 S Canyon Vine Cove
- 1515 E Bluff Point Dr
- 14678 S Silver Blossom Way
- 14775 S Falkland Cove
- 1826 E Gray Fox Dr
- 2151 E Village Vista Dr
- 14767 S Invergarry Ct
- 15095 Alder Glen Ln
- 1481 Meadow Bluff Ln
- 1870 E Oak Bend Dr
- 1492 E Meadow Bluff Ln Unit 48
- 14646 S Woods Landing Ct Unit 7
- 14662 S Woods Landing Ct Unit 6
- 14662 S Woods Landing Ct Unit 6
- 14662 S Woods Landing Ct
- 14632 S Woods Landing Ct Unit 8
- 14632 S Woods Landing Ct Unit 8
- 14678 Woods Landing Ct
- 14609 Woods Landing Ct
- 14641 S Woods Landing Ct Unit 13
- 14694 S Woods Landing Ct
- 14694 S Woods Landing Ct Unit 4
- 14694 Woods Landing Ct
- 14668 Woods Point Cove
- 14613 S Woods Landing Ct Unit 10
- 14613 S Woods Landing Ct Unit 10
- 14668 Woods Point Cove S
- 14637 Woods Landing Ct
- 14662 Woods Point Cove
- 14708 S Woods Landing Ct Unit 3
- 14662 S Woods Point Cove