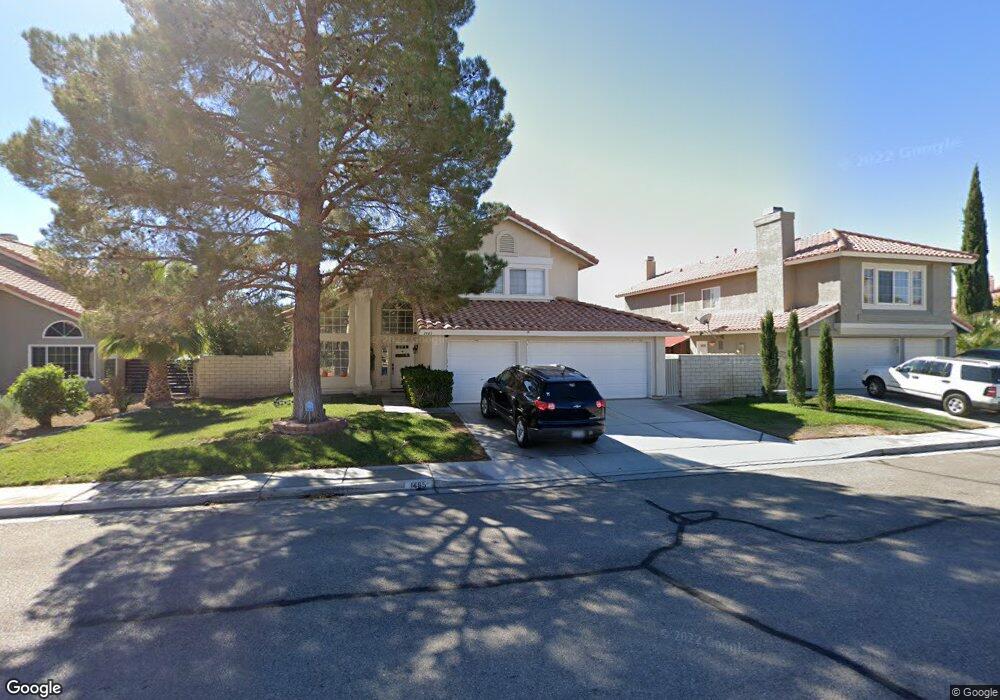
1465 Heather Oaks Way North Las Vegas, NV 89031
Craig Ranch NeighborhoodEstimated Value: $399,444 - $422,000
3
Beds
3
Baths
1,799
Sq Ft
$230/Sq Ft
Est. Value
About This Home
This home is located at 1465 Heather Oaks Way, North Las Vegas, NV 89031 and is currently estimated at $414,611, approximately $230 per square foot. 1465 Heather Oaks Way is a home located in Clark County with nearby schools including Lee Antonello Elementary School, Brian & Teri Cram Middle School, and Legacy High School.
Ownership History
Date
Name
Owned For
Owner Type
Purchase Details
Closed on
Dec 20, 2005
Sold by
Orozco Jose O and Orozco Francisca A
Bought by
Orozco Jose and Alcaraz Norma Leticia
Current Estimated Value
Home Financials for this Owner
Home Financials are based on the most recent Mortgage that was taken out on this home.
Original Mortgage
$259,250
Outstanding Balance
$164,869
Interest Rate
8.7%
Mortgage Type
Unknown
Estimated Equity
$249,742
Purchase Details
Closed on
Aug 28, 2001
Sold by
Anderson Nathaniel and Anderson Victoria
Bought by
Orozco Jose O and Orozco Francisca A
Home Financials for this Owner
Home Financials are based on the most recent Mortgage that was taken out on this home.
Original Mortgage
$120,000
Interest Rate
8.75%
Purchase Details
Closed on
May 22, 1995
Sold by
Brewton Robert L and Brewton Anita M
Bought by
Anderson Nathaniel and Anderson Victoria
Home Financials for this Owner
Home Financials are based on the most recent Mortgage that was taken out on this home.
Original Mortgage
$118,085
Interest Rate
8.32%
Create a Home Valuation Report for This Property
The Home Valuation Report is an in-depth analysis detailing your home's value as well as a comparison with similar homes in the area
Home Values in the Area
Average Home Value in this Area
Purchase History
| Date | Buyer | Sale Price | Title Company |
|---|---|---|---|
| Orozco Jose | $211,500 | National Title Company | |
| Orozco Jose O | $150,000 | Land Title | |
| Anderson Nathaniel | $124,500 | Fidelity National Title |
Source: Public Records
Mortgage History
| Date | Status | Borrower | Loan Amount |
|---|---|---|---|
| Open | Orozco Jose | $259,250 | |
| Closed | Orozco Jose O | $120,000 | |
| Previous Owner | Anderson Nathaniel | $118,085 |
Source: Public Records
Tax History Compared to Growth
Tax History
| Year | Tax Paid | Tax Assessment Tax Assessment Total Assessment is a certain percentage of the fair market value that is determined by local assessors to be the total taxable value of land and additions on the property. | Land | Improvement |
|---|---|---|---|---|
| 2025 | $2,059 | $85,198 | $31,920 | $53,278 |
| 2024 | $1,907 | $85,198 | $31,920 | $53,278 |
| 2023 | $1,907 | $80,964 | $29,925 | $51,039 |
| 2022 | $1,766 | $72,941 | $25,935 | $47,006 |
| 2021 | $1,635 | $67,853 | $22,943 | $44,910 |
| 2020 | $1,516 | $67,360 | $22,610 | $44,750 |
| 2019 | $1,420 | $65,665 | $21,350 | $44,315 |
| 2018 | $1,355 | $59,520 | $16,800 | $42,720 |
| 2017 | $1,963 | $58,532 | $15,050 | $43,482 |
| 2016 | $1,270 | $52,186 | $10,500 | $41,686 |
| 2015 | $1,266 | $42,227 | $8,750 | $33,477 |
| 2014 | $1,229 | $35,552 | $8,750 | $26,802 |
Source: Public Records
Map
Nearby Homes
- 1413 Arc Dome Ave
- 5512 Colorado Breeze Way
- 1642 Heather Ridge Rd
- 5421 Copper Sand Ct
- 5625 Clay Ridge Rd
- 5655 Indian Springs St
- 1415 Black Hills Way
- 1813 Arch Stone Ave
- 5871 Prairie Ridge Cir
- 1009 Nawkee Dr
- 5823 Rose Sage St
- 920 Grey Hollow Ave
- 1901 Desert Sage Ave
- 1916 W Hammer Ln
- 5738 Bear Springs St
- 1515 Fort Dix Cir
- 5808 Lone Song Rd
- 5904 Arrowleaf St
- 5912 Hollowridge Rd
- 5523 Jose Leon St
- 1445 Heather Oaks Way
- 1485 Heather Oaks Way
- 1505 Heather Oaks Way
- 1429 Heather Oaks Way
- 5618 Morning Song Cir
- 5617 Morning Song Cir
- 1370 Red Hollow Dr
- 1415 Heather Oaks Way
- 1515 Heather Oaks Way
- 5551 Jett Canyon St
- 1428 Arc Dome Ave
- 5628 Morning Song Cir
- 5627 Morning Song Cir
- 1424 Arc Dome Ave
- 5620 Farpoint Rd
- 1420 Arc Dome Ave
- 5540 Colorado Breeze Way
- 5547 Jett Canyon St
- 1405 Heather Oaks Way
- 5630 Farpoint Rd