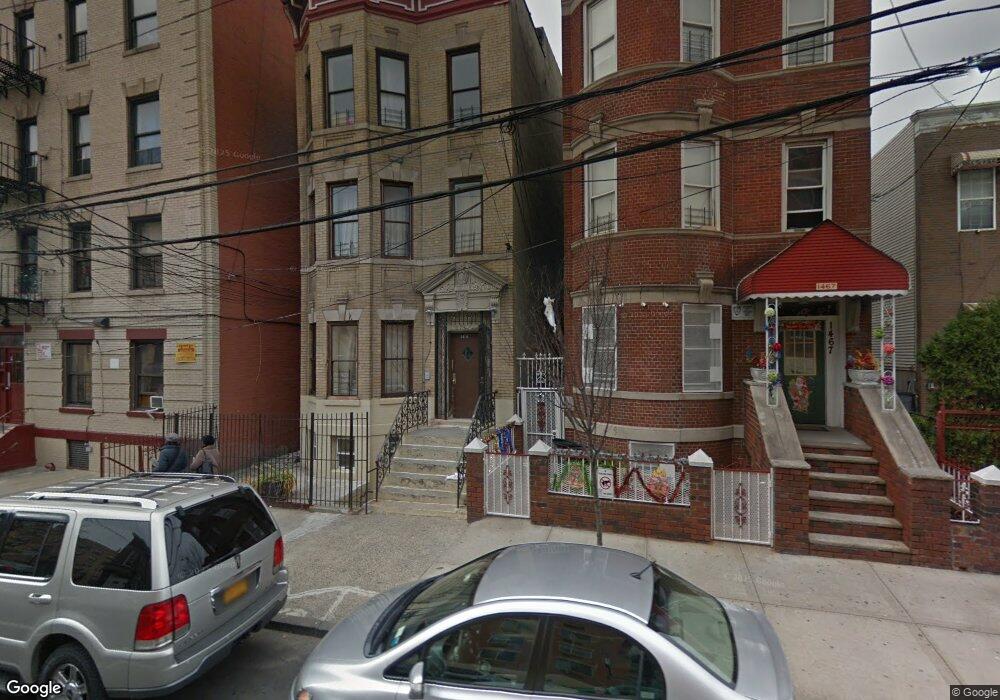
1465 Hoe Ave Unit 3 Bronx, NY 10460
Crotona Park East NeighborhoodEstimated Value: $942,471 - $1,160,000
3
Beds
1
Bath
900
Sq Ft
$1,188/Sq Ft
Est. Value
About This Home
This home is located at 1465 Hoe Ave Unit 3, Bronx, NY 10460 and is currently estimated at $1,069,118, approximately $1,187 per square foot. 1465 Hoe Ave Unit 3 is a home located in Bronx County with nearby schools including P.S. 314 - Fairmont Neighborhood School and P.S. 214.
Ownership History
Date
Name
Owned For
Owner Type
Purchase Details
Closed on
Feb 7, 2018
Sold by
Liburd Brittney Ne
Bought by
1465 Hoe Avenue Llc
Current Estimated Value
Purchase Details
Closed on
Jun 20, 2017
Sold by
Brittney N E Liburd N and Brittney Liburd
Bought by
Liburd Brittney N E
Purchase Details
Closed on
Feb 25, 2008
Sold by
Liburd Lennox S and Liburd Sidney L
Bought by
Liburd Sidney L
Home Financials for this Owner
Home Financials are based on the most recent Mortgage that was taken out on this home.
Original Mortgage
$418,680
Interest Rate
5.93%
Mortgage Type
Purchase Money Mortgage
Purchase Details
Closed on
Mar 18, 1996
Sold by
Garrick Iza C and Liburd Lennox S
Bought by
Luburd Lennox S and Luburd Sidney L
Home Financials for this Owner
Home Financials are based on the most recent Mortgage that was taken out on this home.
Original Mortgage
$122,700
Interest Rate
7.39%
Mortgage Type
FHA
Create a Home Valuation Report for This Property
The Home Valuation Report is an in-depth analysis detailing your home's value as well as a comparison with similar homes in the area
Home Values in the Area
Average Home Value in this Area
Purchase History
| Date | Buyer | Sale Price | Title Company |
|---|---|---|---|
| 1465 Hoe Avenue Llc | $690,000 | -- | |
| 1465 Hoe Avenue Llc | $690,000 | -- | |
| Liburd Brittney N E | -- | -- | |
| Liburd Brittney N E | -- | -- | |
| Liburd Sidney L | -- | -- | |
| Liburd Sidney L | -- | -- | |
| Luburd Lennox S | $68,000 | Commonwealth Land Title Ins | |
| Luburd Lennox S | -- | Commonwealth Land Title Ins |
Source: Public Records
Mortgage History
| Date | Status | Borrower | Loan Amount |
|---|---|---|---|
| Previous Owner | Liburd Sidney L | $418,680 | |
| Previous Owner | Luburd Lennox S | $122,700 |
Source: Public Records
Tax History Compared to Growth
Tax History
| Year | Tax Paid | Tax Assessment Tax Assessment Total Assessment is a certain percentage of the fair market value that is determined by local assessors to be the total taxable value of land and additions on the property. | Land | Improvement |
|---|---|---|---|---|
| 2025 | $4,408 | $23,266 | $5,350 | $17,916 |
| 2024 | $4,408 | $21,949 | $6,012 | $15,937 |
| 2023 | $4,205 | $20,707 | $5,490 | $15,217 |
| 2022 | $4,134 | $49,500 | $12,900 | $36,600 |
| 2021 | $4,329 | $46,500 | $12,900 | $33,600 |
| 2020 | $4,141 | $40,500 | $12,900 | $27,600 |
| 2019 | $3,894 | $36,600 | $12,900 | $23,700 |
| 2018 | $3,043 | $14,929 | $5,794 | $9,135 |
| 2017 | $3,043 | $14,929 | $6,471 | $8,458 |
| 2016 | $2,961 | $14,814 | $6,849 | $7,965 |
| 2015 | $1,479 | $13,976 | $5,678 | $8,298 |
| 2014 | $1,479 | $13,186 | $4,556 | $8,630 |
Source: Public Records
Map
Nearby Homes
- 1456 Bryant Ave
- 1538 Hoe Ave
- 1455 Seabury Place
- 1405 Louis Niñé Blvd
- 1552 Bryant Ave
- 1380 Bristow St
- 1568 Bryant Ave
- 1567 Longfellow Ave
- 1347 Bristow St Unit 4B
- 1192 Fox St
- 1333 Bristow St
- 1321 Bristow St
- 1574 Crotona Park E
- 815 E 170th St
- 1170 Vyse Ave
- 807 E 170th St
- 805 E 170th St
- 1670 Longfellow Ave Unit 6J
- 1670 Longfellow Ave Unit 4A
- 1670 Longfellow Ave Unit 3J
- 1465 Hoe Ave
- 1467 Hoe Ave
- 1463 Hoe Ave
- 1469 Hoe Ave
- 1469 Hoe Ave Unit 3
- 1471 Hoe Ave
- 939 Jennings St
- 931 Jennings St
- 937 Jennings St
- 1473 Hoe Ave
- 1466 Southern Blvd
- 1464 Southern Blvd
- 1475 Hoe Ave
- 1462 Southern Blvd Unit 3B
- 1462 Southern Blvd
- 1476 Southern Blvd
- 927 Jennings St
- 1477 Hoe Ave
- 1478 Southern Blvd
- 1349 Hoe Ave