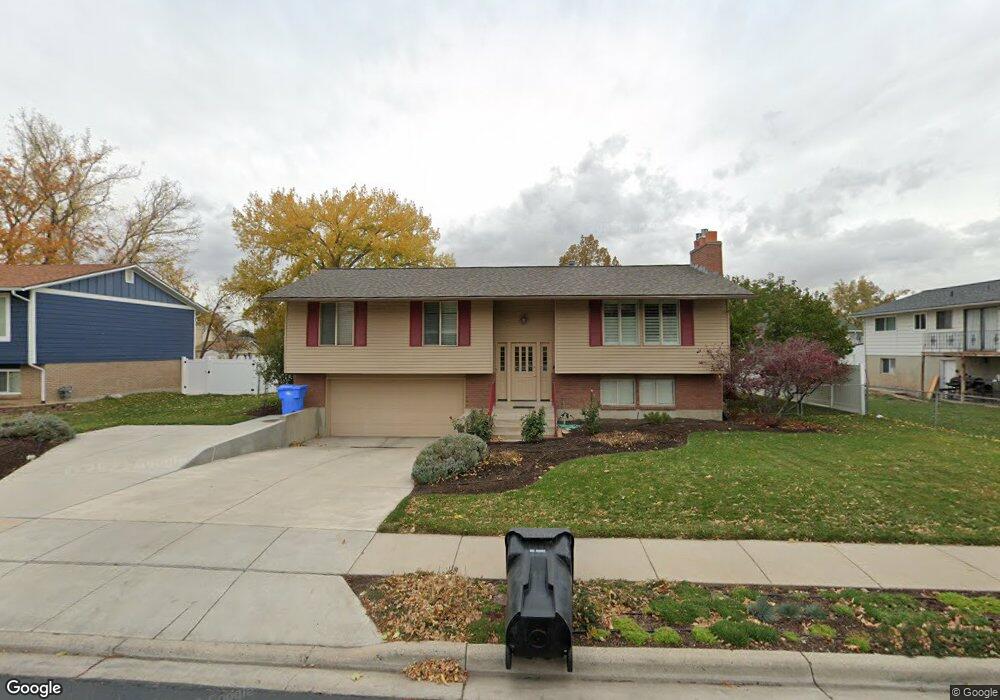
1465 N 600 W West Bountiful, UT 84087
Estimated Value: $506,000 - $539,000
4
Beds
3
Baths
1,950
Sq Ft
$270/Sq Ft
Est. Value
About This Home
This home is located at 1465 N 600 W, West Bountiful, UT 84087 and is currently estimated at $525,720, approximately $269 per square foot. 1465 N 600 W is a home located in Davis County with nearby schools including West Bountiful Elementary School, Bountiful Junior High School, and Viewmont High School.
Ownership History
Date
Name
Owned For
Owner Type
Purchase Details
Closed on
Jun 6, 1998
Sold by
Vanwagoner Jon N and Vanwagoner Alayne E
Bought by
Rice Mark E and Rice Shaunna L
Current Estimated Value
Home Financials for this Owner
Home Financials are based on the most recent Mortgage that was taken out on this home.
Original Mortgage
$80,000
Outstanding Balance
$15,632
Interest Rate
7.1%
Estimated Equity
$510,088
Purchase Details
Closed on
Sep 3, 1997
Sold by
Thornton Scott C
Bought by
Vanwagoner Jon N and Vanwagoner Alayne E
Home Financials for this Owner
Home Financials are based on the most recent Mortgage that was taken out on this home.
Original Mortgage
$133,000
Interest Rate
7.42%
Create a Home Valuation Report for This Property
The Home Valuation Report is an in-depth analysis detailing your home's value as well as a comparison with similar homes in the area
Home Values in the Area
Average Home Value in this Area
Purchase History
| Date | Buyer | Sale Price | Title Company |
|---|---|---|---|
| Rice Mark E | -- | Equity Title Agency | |
| Vanwagoner Jon N | -- | Backman Stewart Title Servic |
Source: Public Records
Mortgage History
| Date | Status | Borrower | Loan Amount |
|---|---|---|---|
| Open | Rice Mark E | $80,000 | |
| Previous Owner | Vanwagoner Jon N | $133,000 |
Source: Public Records
Tax History
| Year | Tax Paid | Tax Assessment Tax Assessment Total Assessment is a certain percentage of the fair market value that is determined by local assessors to be the total taxable value of land and additions on the property. | Land | Improvement |
|---|---|---|---|---|
| 2025 | $2,939 | $256,300 | $144,603 | $111,697 |
| 2024 | $2,754 | $245,850 | $119,042 | $126,808 |
| 2023 | $2,649 | $434,000 | $224,260 | $209,740 |
| 2022 | $2,788 | $256,300 | $108,313 | $147,987 |
| 2021 | $2,605 | $368,000 | $147,506 | $220,494 |
| 2020 | $2,239 | $312,000 | $135,771 | $176,229 |
| 2019 | $2,203 | $304,000 | $136,127 | $167,873 |
| 2018 | $2,052 | $279,000 | $135,001 | $143,999 |
| 2016 | $1,766 | $130,185 | $36,645 | $93,540 |
| 2015 | $1,712 | $119,900 | $36,645 | $83,255 |
| 2014 | $1,693 | $121,935 | $36,288 | $85,647 |
| 2013 | -- | $106,344 | $31,803 | $74,541 |
Source: Public Records
Map
Nearby Homes
- 1520 N 550 W
- 1625 Pages Place
- 1503 N 300 W
- 328 W Pages Ln
- 591 W 2050 N
- 366 W 1000 N
- 204 Lyman Ln
- 1260 N 200 W
- 1130 N 200 W
- 324 S 600 W
- 563 N 200 W
- 988 W 1950 N Unit 134
- 2339 N 800 W
- 1084 W Audrey Ln
- 998 W 1950 N
- 499 N 200 W Unit 18
- 499 N 200 W Unit 19
- 65 W 850 S
- 403 W 400 N Unit 1
- 401 W 400 N Unit 49
Your Personal Tour Guide
Ask me questions while you tour the home.