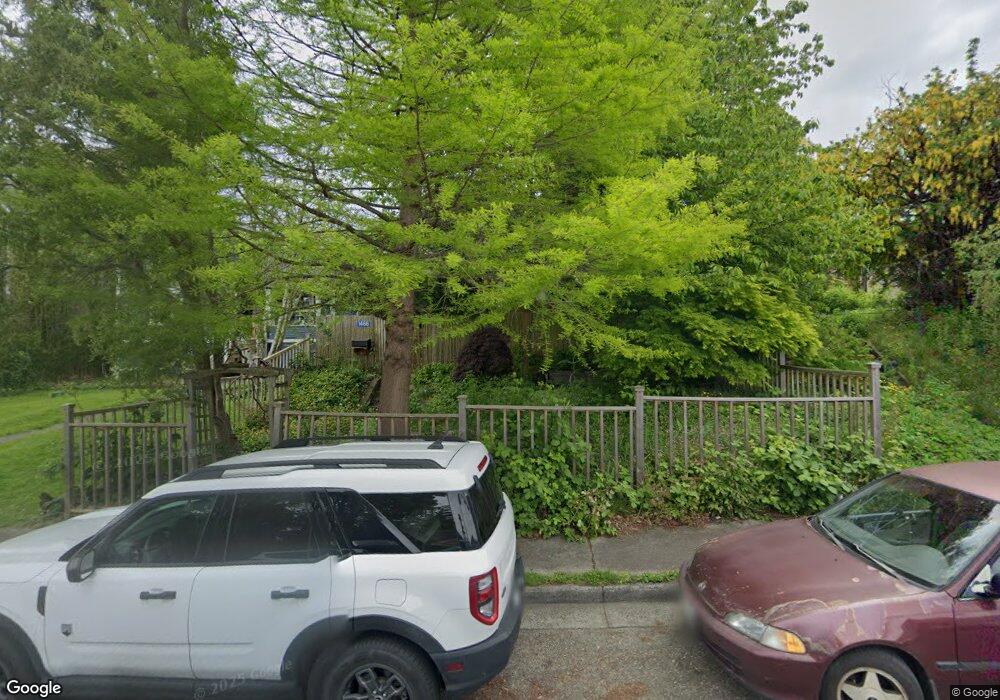
1466 Franklin St Bellingham, WA 98225
York NeighborhoodEstimated Value: $716,000 - $806,000
3
Beds
1
Bath
1,502
Sq Ft
$501/Sq Ft
Est. Value
About This Home
This home is located at 1466 Franklin St, Bellingham, WA 98225 and is currently estimated at $751,905, approximately $500 per square foot. 1466 Franklin St is a home located in Whatcom County with nearby schools including Lowell Elementary School, Fairhaven Middle School, and Sehome High School.
Ownership History
Date
Name
Owned For
Owner Type
Purchase Details
Closed on
Nov 5, 2018
Sold by
Godwin Maureen F
Bought by
Godwin Maureen F and Godwin Family Revocable Trust
Current Estimated Value
Purchase Details
Closed on
Feb 2, 2012
Sold by
Godwin Maureen F
Bought by
Godwin Maureen F
Purchase Details
Closed on
Aug 3, 2007
Sold by
Mccaulley Brian H
Bought by
Godwin Thomas S and Godwin Maureen F
Home Financials for this Owner
Home Financials are based on the most recent Mortgage that was taken out on this home.
Original Mortgage
$240,000
Interest Rate
6.66%
Mortgage Type
Purchase Money Mortgage
Purchase Details
Closed on
Feb 18, 2005
Sold by
Artmann Karin
Bought by
Mccaulley Brian Hub
Create a Home Valuation Report for This Property
The Home Valuation Report is an in-depth analysis detailing your home's value as well as a comparison with similar homes in the area
Home Values in the Area
Average Home Value in this Area
Purchase History
| Date | Buyer | Sale Price | Title Company |
|---|---|---|---|
| Godwin Maureen F | -- | None Available | |
| Godwin Maureen F | -- | None Available | |
| Godwin Thomas S | $340,280 | Whatcom Land Title | |
| Mccaulley Brian Hub | -- | -- |
Source: Public Records
Mortgage History
| Date | Status | Borrower | Loan Amount |
|---|---|---|---|
| Previous Owner | Godwin Thomas S | $240,000 |
Source: Public Records
Tax History Compared to Growth
Tax History
| Year | Tax Paid | Tax Assessment Tax Assessment Total Assessment is a certain percentage of the fair market value that is determined by local assessors to be the total taxable value of land and additions on the property. | Land | Improvement |
|---|---|---|---|---|
| 2024 | $6,089 | $763,067 | $277,092 | $485,975 |
| 2023 | $6,089 | $782,448 | $284,130 | $498,318 |
| 2022 | $4,973 | $674,536 | $244,944 | $429,592 |
| 2021 | $4,879 | $535,346 | $194,400 | $340,946 |
| 2020 | $4,463 | $495,691 | $180,000 | $315,691 |
| 2019 | $3,996 | $438,338 | $139,751 | $298,587 |
| 2018 | $598 | $393,461 | $125,471 | $267,990 |
| 2017 | $633 | $338,758 | $108,024 | $230,734 |
| 2016 | $630 | $305,533 | $96,936 | $208,597 |
| 2015 | $657 | $278,235 | $88,536 | $189,699 |
| 2014 | -- | $263,980 | $84,000 | $179,980 |
| 2013 | -- | $252,817 | $78,750 | $174,067 |
Source: Public Records
Map
Nearby Homes
- 5 XX Gladstone St
- 1309 Billy Frank Jr St
- 1470 James St
- 910 Gladstone St Unit 205
- 1234 Grant St
- 1724 Iron St
- 1126 N Forest St
- 1031 N State St Unit 107
- 1031 N State St Unit 209
- 1356 Orleans St
- 1001 N State St Unit 403
- 1015 Railroad Ave Unit 418
- 1205 E Maple St
- 615 E Myrtle St
- 2019 Cornwall Ave
- 2111 Franklin St
- 616 E Myrtle St
- 901 N Forest St Unit 107
- 901 N Forest St Unit 125
- 901 N Forest St Unit 109
- 1462 Franklin St
- 1462 Franklin St
- 1468 Franklin St
- 1456 Franklin St
- 1452 Franklin St
- 1465 Grant St
- 1461 Grant St
- 1471 Grant St
- 1457 Grant St
- 1446 Franklin St
- 1473 Franklin St
- 1475 Grant St
- 1453 Grant St
- 310 Gladstone St
- 1463 Franklin St
- 1461 Franklin St
- 1444 Franklin St Unit 2
- 1444 Franklin St
- 1451 Grant St
- 1455 Franklin St