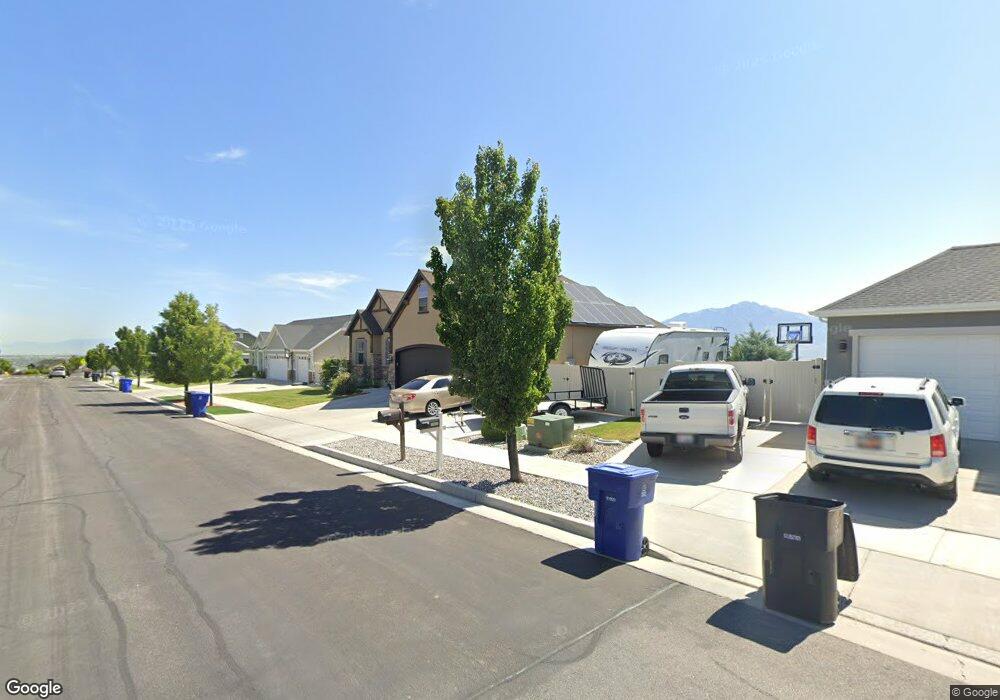
14667 S Highfield Dr Herriman, UT 84096
Estimated Value: $711,000 - $803,402
4
Beds
3
Baths
3,822
Sq Ft
$199/Sq Ft
Est. Value
About This Home
This home is located at 14667 S Highfield Dr, Herriman, UT 84096 and is currently estimated at $762,351, approximately $199 per square foot. 14667 S Highfield Dr is a home located in Salt Lake County with nearby schools including Foothills School, South Hills Middle School, and Mountain Ridge High School.
Ownership History
Date
Name
Owned For
Owner Type
Purchase Details
Closed on
Jul 31, 2019
Sold by
Kory Yeager Llc
Bought by
Yeager Kory and Yeager Sarah
Current Estimated Value
Purchase Details
Closed on
Jul 20, 2016
Sold by
Yeager Kory
Bought by
Kory Yeager Llc
Home Financials for this Owner
Home Financials are based on the most recent Mortgage that was taken out on this home.
Original Mortgage
$90,000
Interest Rate
3.6%
Mortgage Type
Credit Line Revolving
Purchase Details
Closed on
Apr 14, 2015
Sold by
Yeager Sarah and Yeager Kory
Bought by
Kory Yeager Llc
Purchase Details
Closed on
Feb 27, 2014
Sold by
Victory Homes Inc
Bought by
Yeager Kory and Yeager Sarah
Purchase Details
Closed on
Aug 19, 2013
Sold by
Rosecrest Communities Llc
Bought by
Victory Homes Inc
Home Financials for this Owner
Home Financials are based on the most recent Mortgage that was taken out on this home.
Original Mortgage
$288,000
Interest Rate
4.51%
Mortgage Type
Construction
Create a Home Valuation Report for This Property
The Home Valuation Report is an in-depth analysis detailing your home's value as well as a comparison with similar homes in the area
Home Values in the Area
Average Home Value in this Area
Purchase History
| Date | Buyer | Sale Price | Title Company |
|---|---|---|---|
| Yeager Kory | -- | Title Guarantee S Jordan | |
| Kory Yeager Llc | -- | Accommodation | |
| Yeager Kory | -- | Accommodation | |
| Kory Yeager Llc | -- | Accommodation | |
| Yeager Kory | -- | Metro National Title | |
| Victory Homes Inc | -- | Metro National Title |
Source: Public Records
Mortgage History
| Date | Status | Borrower | Loan Amount |
|---|---|---|---|
| Previous Owner | Yeager Kory | $90,000 | |
| Previous Owner | Victory Homes Inc | $288,000 | |
| Closed | Yeager Kory | $0 |
Source: Public Records
Tax History Compared to Growth
Tax History
| Year | Tax Paid | Tax Assessment Tax Assessment Total Assessment is a certain percentage of the fair market value that is determined by local assessors to be the total taxable value of land and additions on the property. | Land | Improvement |
|---|---|---|---|---|
| 2025 | $4,445 | $774,800 | $207,600 | $567,200 |
| 2024 | $4,445 | $729,000 | $195,700 | $533,300 |
| 2023 | $4,487 | $696,400 | $193,800 | $502,600 |
| 2022 | $4,589 | $710,200 | $190,000 | $520,200 |
| 2021 | $4,048 | $550,000 | $155,000 | $395,000 |
| 2020 | $3,753 | $480,600 | $140,000 | $340,600 |
| 2019 | $3,557 | $447,800 | $72,000 | $375,800 |
| 2018 | $3,370 | $417,800 | $67,200 | $350,600 |
| 2017 | $3,208 | $393,200 | $67,200 | $326,000 |
| 2016 | $3,208 | $371,700 | $67,200 | $304,500 |
| 2015 | $2,957 | $337,000 | $74,200 | $262,800 |
| 2014 | $1,669 | $186,300 | $68,500 | $117,800 |
Source: Public Records
Map
Nearby Homes
- 4591 W Heritagefield Cir
- 4657 W Etonboro Dr
- 4472 W Birkdale Dr
- 4863 W River Chase Rd
- 14427 S Attleboro Dr
- 14662 S Birken St
- 14908 S Fawley Ln
- 14512 S Quiet Shade Dr
- 14933 S Fawley Ln
- 14558 S Quiet Shade Dr
- 14649 S Quiet Glen Dr
- 4894 W Chrome Rd Unit 48
- 11682 S Shadow Bend Ln
- 4753 Mossley Bend Dr
- 4773 W Mossley Bend Dr
- 4361 W Hemsley Ln Unit 167
- 4784 W Juniper Bend Cir
- 4823 W Mossley Bend Dr
- 4357 W Hemsley Ln
- 4472 W Lone Shadow Ln
- 14683 S Highfield Dr Unit 5
- 14649 S Highfield Dr Unit 3
- 14649 S Highfield Dr
- 4646 W Brookport Cir
- 14666 S Highfield Dr Unit 27
- 14654 S Highfield Dr
- 14682 S Highfield Dr Unit 28
- 14682 S Highfield Dr
- 14633 S Highfield Dr Unit 2
- 4628 W Brookport Cir Unit 7
- 14638 S Highfield Dr Unit 25
- 4667 W Brookport Cir Unit 12
- 4651 W Brookport Cir
- 14667 S Branford Ln Unit 30
- 4683 W Branford Ln Unit V13
- 14681 S Branford Ln Unit 29
- 14619 S Highfield Dr Unit 1
- 14653 S Branford Ln Unit 31
- 4637 W Brookport Cir Unit V3/10
- 14643 S Branford Ln Unit 32