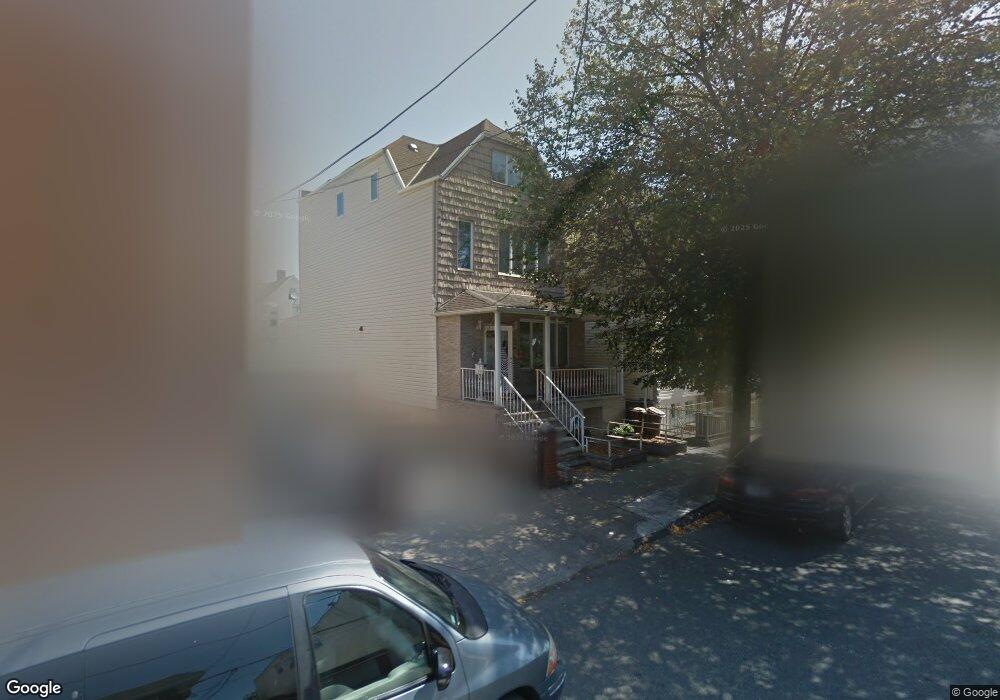
1467 71st St Brooklyn, NY 11228
Bensonhurst NeighborhoodEstimated Value: $1,106,031 - $1,342,000
Studio
--
Bath
1,890
Sq Ft
$656/Sq Ft
Est. Value
About This Home
This home is located at 1467 71st St, Brooklyn, NY 11228 and is currently estimated at $1,240,008, approximately $656 per square foot. 1467 71st St is a home located in Kings County with nearby schools including P.S. 112 Lefferts Park Elementary School, Junior High School 227 Edward B Shallow, and New Utrecht High School.
Ownership History
Date
Name
Owned For
Owner Type
Purchase Details
Closed on
Nov 12, 2010
Sold by
Englard Lemor and Yitz Grossman 1999 Insurance Trust
Bought by
Huang Joseph
Current Estimated Value
Home Financials for this Owner
Home Financials are based on the most recent Mortgage that was taken out on this home.
Original Mortgage
$385,000
Outstanding Balance
$253,412
Interest Rate
4.3%
Mortgage Type
Purchase Money Mortgage
Estimated Equity
$986,596
Purchase Details
Closed on
Oct 2, 2008
Sold by
Ab 53Rd Street Corp
Bought by
Englard Lemor and Yitz Grossman 1999 Insurance Trust
Purchase Details
Closed on
May 16, 2006
Sold by
Claudino Lisa
Bought by
Ab 53Rd Street Corp
Home Financials for this Owner
Home Financials are based on the most recent Mortgage that was taken out on this home.
Original Mortgage
$540,000
Interest Rate
6.62%
Mortgage Type
Purchase Money Mortgage
Purchase Details
Closed on
Apr 8, 2004
Sold by
Claudino Maria
Bought by
Claudino Lisa
Create a Home Valuation Report for This Property
The Home Valuation Report is an in-depth analysis detailing your home's value as well as a comparison with similar homes in the area
Home Values in the Area
Average Home Value in this Area
Purchase History
| Date | Buyer | Sale Price | Title Company |
|---|---|---|---|
| Huang Joseph | $570,000 | -- | |
| Huang Joseph | $570,000 | -- | |
| Englard Lemor | -- | -- | |
| Englard Lemor | -- | -- | |
| Ab 53Rd Street Corp | $487,500 | -- | |
| Ab 53Rd Street Corp | $487,500 | -- | |
| Claudino Lisa | -- | -- | |
| Claudino Lisa | -- | -- |
Source: Public Records
Mortgage History
| Date | Status | Borrower | Loan Amount |
|---|---|---|---|
| Open | Huang Joseph | $385,000 | |
| Closed | Huang Joseph | $385,000 | |
| Previous Owner | Ab 53Rd Street Corp | $540,000 |
Source: Public Records
Tax History
| Year | Tax Paid | Tax Assessment Tax Assessment Total Assessment is a certain percentage of the fair market value that is determined by local assessors to be the total taxable value of land and additions on the property. | Land | Improvement |
|---|---|---|---|---|
| 2025 | $7,081 | $73,200 | $10,620 | $62,580 |
| 2024 | $7,081 | $73,680 | $10,620 | $63,060 |
| 2023 | $6,810 | $77,760 | $10,620 | $67,140 |
| 2022 | $6,351 | $79,200 | $10,620 | $68,580 |
| 2021 | $6,334 | $69,240 | $10,620 | $58,620 |
| 2020 | $3,149 | $70,200 | $10,620 | $59,580 |
| 2019 | $6,146 | $70,200 | $10,620 | $59,580 |
| 2018 | $5,697 | $27,945 | $4,854 | $23,091 |
| 2017 | $5,404 | $26,512 | $5,508 | $21,004 |
| 2016 | $5,014 | $25,081 | $4,884 | $20,197 |
| 2015 | $3,017 | $25,081 | $6,815 | $18,266 |
| 2014 | $3,017 | $24,482 | $7,680 | $16,802 |
Source: Public Records
Map
Nearby Homes
- 1456 Bay Ridge Ave
- 1476 72nd St
- 6909 15th Ave
- 1530 71st St
- 6915 14th Ave
- 1535 72nd St
- 1379 70th St Unit 3B
- 1424 68th St
- 1366 70th St
- 1548 72nd St Unit 302
- 1548 72nd St Unit 301
- 6814 14th Ave
- 6801 New Utrecht Ave
- 1536 68th St
- 1564 Bay Ridge Ave
- 1472 67th St
- 1569 70th St
- 1476 67th St Unit 1
- 7325 14th Ave
- 1337 71st St
Your Personal Tour Guide
Ask me questions while you tour the home.