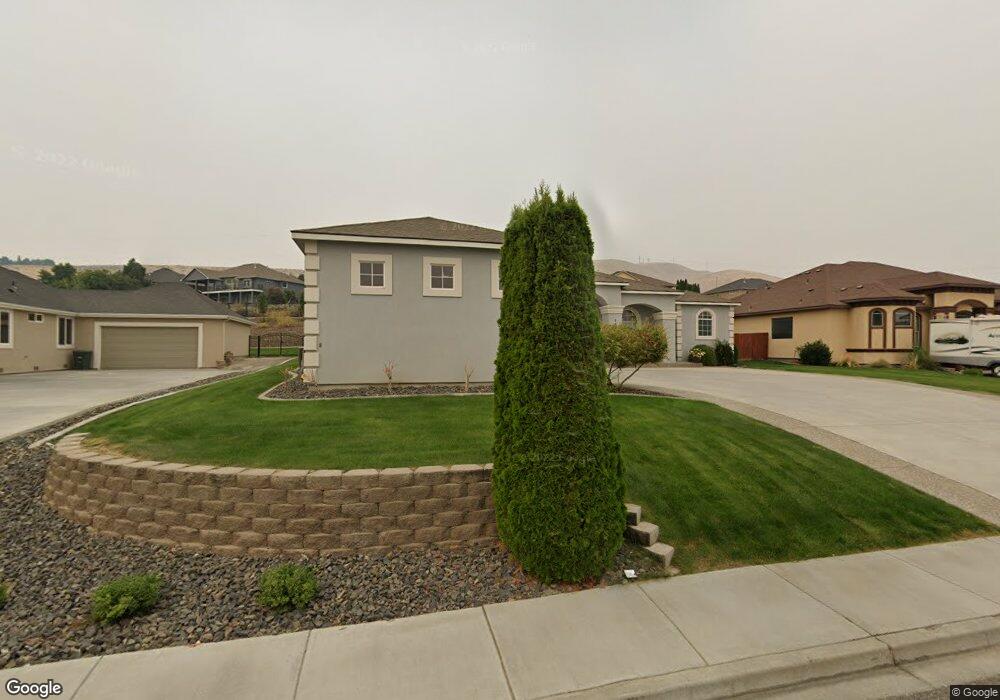
1467 Badger Mountain Loop Richland, WA 99352
Estimated Value: $673,193 - $722,000
3
Beds
4
Baths
2,820
Sq Ft
$247/Sq Ft
Est. Value
About This Home
This home is located at 1467 Badger Mountain Loop, Richland, WA 99352 and is currently estimated at $697,048, approximately $247 per square foot. 1467 Badger Mountain Loop is a home located in Benton County with nearby schools including Orchard Elementary School, Enterprise Middle School, and Richland High School.
Ownership History
Date
Name
Owned For
Owner Type
Purchase Details
Closed on
May 13, 2009
Sold by
Total Quality Construction Inc
Bought by
Thomas Rene L
Current Estimated Value
Home Financials for this Owner
Home Financials are based on the most recent Mortgage that was taken out on this home.
Original Mortgage
$286,300
Outstanding Balance
$176,377
Interest Rate
4.71%
Mortgage Type
VA
Estimated Equity
$520,671
Purchase Details
Closed on
May 12, 2009
Sold by
Thomas Magdalena S
Bought by
Thomas Rene L
Home Financials for this Owner
Home Financials are based on the most recent Mortgage that was taken out on this home.
Original Mortgage
$286,300
Outstanding Balance
$176,377
Interest Rate
4.71%
Mortgage Type
VA
Estimated Equity
$520,671
Purchase Details
Closed on
Nov 13, 2008
Sold by
Badger Mountain Village Investments Llc
Bought by
Total Quality Construction Inc
Home Financials for this Owner
Home Financials are based on the most recent Mortgage that was taken out on this home.
Original Mortgage
$280,800
Interest Rate
5.9%
Mortgage Type
Purchase Money Mortgage
Create a Home Valuation Report for This Property
The Home Valuation Report is an in-depth analysis detailing your home's value as well as a comparison with similar homes in the area
Home Values in the Area
Average Home Value in this Area
Purchase History
| Date | Buyer | Sale Price | Title Company |
|---|---|---|---|
| Thomas Rene L | $350,816 | Cascade Title | |
| Thomas Rene L | -- | Cascade Title | |
| Total Quality Construction Inc | $62,000 | Benton Franklin Title Co |
Source: Public Records
Mortgage History
| Date | Status | Borrower | Loan Amount |
|---|---|---|---|
| Open | Thomas Rene L | $286,300 | |
| Previous Owner | Total Quality Construction Inc | $280,800 |
Source: Public Records
Tax History
| Year | Tax Paid | Tax Assessment Tax Assessment Total Assessment is a certain percentage of the fair market value that is determined by local assessors to be the total taxable value of land and additions on the property. | Land | Improvement |
|---|---|---|---|---|
| 2025 | $601 | $708,840 | $100,000 | $608,840 |
| 2024 | $5,525 | $640,330 | $100,000 | $540,330 |
| 2023 | $5,525 | $592,650 | $100,000 | $492,650 |
| 2022 | $4,967 | $497,300 | $100,000 | $397,300 |
| 2021 | $4,815 | $449,620 | $100,000 | $349,620 |
| 2020 | $5,729 | $417,840 | $100,000 | $317,840 |
| 2019 | $4,663 | $470,640 | $58,000 | $412,640 |
| 2018 | $4,777 | $411,690 | $58,000 | $353,690 |
| 2017 | $4,223 | $352,740 | $58,000 | $294,740 |
| 2016 | $4,599 | $352,740 | $58,000 | $294,740 |
| 2015 | $4,669 | $352,740 | $58,000 | $294,740 |
| 2014 | -- | $352,740 | $58,000 | $294,740 |
| 2013 | -- | $352,740 | $58,000 | $294,740 |
Source: Public Records
Map
Nearby Homes
- 1430 Purple Sage St
- 586 Lodi Loop
- 656 Lago Vista Dr
- 1418 Chardonnay Dr
- 1633 Meadow Hills Dr
- 1359 White Bluffs St
- 1658 Sorrento Ln
- 1352 Westgate Way
- 1282 Paige St
- 664 Punkie Ln
- 683 Isola Vista Ct
- 1953 Gala Way
- 654 Nastacia St
- 1240 Vintage Ave
- 2846 Sumac Dr
- 450 Winesap Ct
- 1294 White Bluffs St
- 1133 Fairhaven Loop Unit 9
- 1101 Fairhaven Loop
- 1102 Fairhaven Loop Unit 34
- 1463 Badger Mountain Loop
- 1471 Badger Mountain Loop
- 1459 Badger Mountain Loop
- 1466 Badger Mountain Loop Unit AMAZING VIEW - LUXUR
- 1466 Badger Mountain Loop Unit AMAZING VIEW - DROUG
- 1466 Badger Mountain Loop Unit LUXURY HOME WITH VIE
- 1466 Badger Mountain Loop Unit 2 bedroom 3 bath (3r
- 1466 Badger Mountain Loop
- 1470 Badger Mountain Loop
- 1462 Badger Mountain Loop
- 1450 Blue Mountain Loop
- 1454 Blue Mountain Loop
- 1475 Badger Mountain Loop
- 1455 Badger Mountain Loop
- 1460 Badger Mountain Loop
- 1480 Badger Mountain Loop
- 1448 Blue Mountain Loop
- 1458 Blue Mountain Loop
- 1479 Badger Mountain Loop
- 1456 Badger Mountain Loop
Your Personal Tour Guide
Ask me questions while you tour the home.