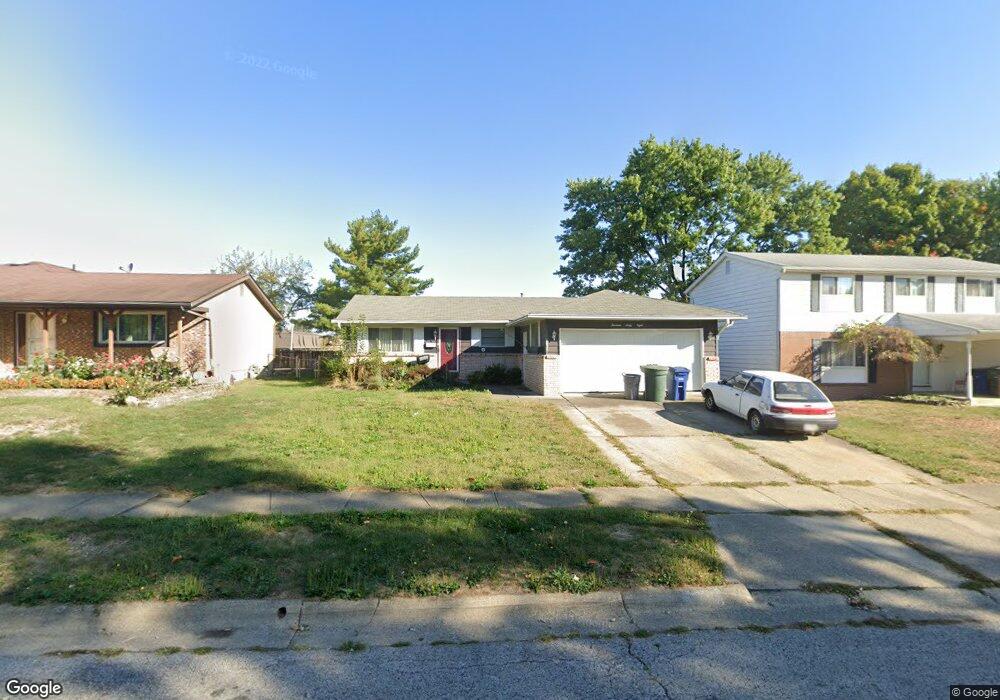
1468 Bolenhill Ave Columbus, OH 43229
Devonshire NeighborhoodEstimated Value: $273,181 - $317,000
3
Beds
2
Baths
1,322
Sq Ft
$223/Sq Ft
Est. Value
About This Home
This home is located at 1468 Bolenhill Ave, Columbus, OH 43229 and is currently estimated at $294,545, approximately $222 per square foot. 1468 Bolenhill Ave is a home located in Franklin County with nearby schools including Colonial Hills Elementary School, Kilbourne Middle School, and Thomas Worthington High School.
Ownership History
Date
Name
Owned For
Owner Type
Purchase Details
Closed on
Oct 27, 2020
Sold by
Storts Robert W
Bought by
Wilson Amy A and Wilson Benjamin J
Current Estimated Value
Purchase Details
Closed on
Jun 27, 2006
Sold by
Estes David J and Estes Janetta S
Bought by
Storts Robert W and Storts Juanita L
Purchase Details
Closed on
May 16, 2002
Sold by
Palenshus Arlene W
Bought by
Estes David J and Estes Janetta S
Home Financials for this Owner
Home Financials are based on the most recent Mortgage that was taken out on this home.
Original Mortgage
$120,074
Interest Rate
7%
Mortgage Type
FHA
Purchase Details
Closed on
May 21, 1987
Bought by
Palenshus Otto A
Create a Home Valuation Report for This Property
The Home Valuation Report is an in-depth analysis detailing your home's value as well as a comparison with similar homes in the area
Home Values in the Area
Average Home Value in this Area
Purchase History
| Date | Buyer | Sale Price | Title Company |
|---|---|---|---|
| Wilson Amy A | -- | Valmer Land Title Agency | |
| Storts Robert W | $137,000 | Chicago Tit | |
| Estes David J | $122,000 | Title First Agency Inc | |
| Palenshus Otto A | $65,500 | -- |
Source: Public Records
Mortgage History
| Date | Status | Borrower | Loan Amount |
|---|---|---|---|
| Previous Owner | Estes David J | $120,074 |
Source: Public Records
Tax History Compared to Growth
Tax History
| Year | Tax Paid | Tax Assessment Tax Assessment Total Assessment is a certain percentage of the fair market value that is determined by local assessors to be the total taxable value of land and additions on the property. | Land | Improvement |
|---|---|---|---|---|
| 2024 | $4,408 | $70,420 | $19,600 | $50,820 |
| 2023 | $4,219 | $70,420 | $19,600 | $50,820 |
| 2022 | $3,865 | $51,170 | $12,600 | $38,570 |
| 2021 | $3,572 | $51,170 | $12,600 | $38,570 |
| 2020 | $2,789 | $51,170 | $12,600 | $38,570 |
| 2019 | $2,308 | $40,430 | $10,080 | $30,350 |
| 2018 | $1,118 | $40,430 | $10,080 | $30,350 |
| 2017 | $2,069 | $40,430 | $10,080 | $30,350 |
| 2016 | $1,969 | $36,480 | $7,670 | $28,810 |
| 2015 | $985 | $36,480 | $7,670 | $28,810 |
| 2014 | $1,968 | $36,480 | $7,670 | $28,810 |
| 2013 | $1,121 | $40,495 | $8,505 | $31,990 |
Source: Public Records
Map
Nearby Homes
- 1421 Bosworth Place
- 1409 Bosworth Place
- 1322 Bolenhill Ct
- 1294 Clydesdale Ct
- 1635 Tendril Ct
- 6458 Faircrest Rd
- 6407 Faircrest Rd
- 1268 Kildale Ct
- 1755 Hillandale Ave
- 6342 Bellmeadow Dr
- 6407 Skywae Dr
- 6496 Hearthstone Ave
- 1947 Rockdale Dr Unit 33
- 1549 Alpine Dr
- 6355 Johnanne St
- 1288 Oakfield Dr N
- 6245 Sharon Woods Blvd
- 6448 Sharon Woods Blvd Unit B
- 6189 Northgap Dr
- 6211 Parkdale Dr
- 1460 Bolenhill Ave
- 1476 Bolenhill Ave
- 1484 Bolenhill Ave
- 1452 Bolenhill Ave
- 1471 Bolenhill Ave
- 6640 Devonhill Rd
- 1492 Bolenhill Ave
- 1479 Bolenhill Ave
- 1487 Bolenhill Ave
- 1500 Bolenhill Ave
- 6632 Devonhill Rd
- 1436 Bolenhill Ave
- 1495 Bolenhill Ave
- 1474 Devonhill Ct
- 1435 Bolenhill Ave
- 1508 Bolenhill Ave
- 1428 Bolenhill Ave
- 6633 Barrett Ln
- 1486 Devonhill Ct
- 6622 Devonhill Rd