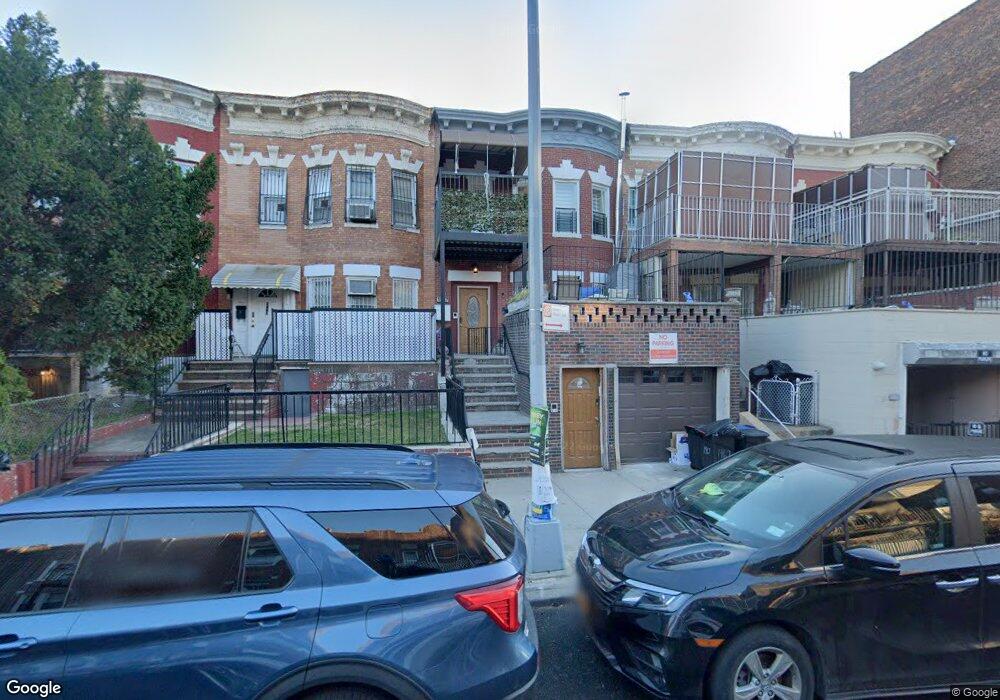
1469 41st St Brooklyn, NY 11218
Borough Park NeighborhoodEstimated Value: $1,408,565 - $1,923,000
Studio
--
Bath
2,060
Sq Ft
$786/Sq Ft
Est. Value
About This Home
This home is located at 1469 41st St, Brooklyn, NY 11218 and is currently estimated at $1,618,891, approximately $785 per square foot. 1469 41st St is a home located in Kings County with nearby schools including P.S. 164 Caesar Rodney School, I.S. 223 The Montauk, and Franklin Delano Roosevelt High School.
Ownership History
Date
Name
Owned For
Owner Type
Purchase Details
Closed on
Feb 27, 2012
Sold by
Ganzfried Erwin
Bought by
Chaim Lefkowitz Trustee and Erwin Ganzfried, Trustee
Current Estimated Value
Purchase Details
Closed on
Dec 17, 2010
Sold by
Esposito Rose
Bought by
Ganzfried Erwin
Home Financials for this Owner
Home Financials are based on the most recent Mortgage that was taken out on this home.
Original Mortgage
$507,500
Interest Rate
4.37%
Mortgage Type
Purchase Money Mortgage
Purchase Details
Closed on
Jan 7, 1997
Sold by
Esposito Rose
Bought by
Russo Diane R and Russo Daniel S
Create a Home Valuation Report for This Property
The Home Valuation Report is an in-depth analysis detailing your home's value as well as a comparison with similar homes in the area
Home Values in the Area
Average Home Value in this Area
Purchase History
| Date | Buyer | Sale Price | Title Company |
|---|---|---|---|
| Chaim Lefkowitz Trustee | -- | -- | |
| Ganzfried Erwin | $725,000 | -- | |
| Russo Diane R | -- | Commonwealth Land Title Ins |
Source: Public Records
Mortgage History
| Date | Status | Borrower | Loan Amount |
|---|---|---|---|
| Previous Owner | Ganzfried Erwin | $507,500 |
Source: Public Records
Tax History
| Year | Tax Paid | Tax Assessment Tax Assessment Total Assessment is a certain percentage of the fair market value that is determined by local assessors to be the total taxable value of land and additions on the property. | Land | Improvement |
|---|---|---|---|---|
| 2025 | $6,563 | $75,240 | $22,320 | $52,920 |
| 2024 | $6,563 | $88,500 | $22,320 | $66,180 |
| 2023 | $6,578 | $79,320 | $22,320 | $57,000 |
| 2022 | $6,101 | $75,420 | $22,320 | $53,100 |
| 2021 | $6,070 | $62,940 | $22,320 | $40,620 |
| 2020 | $3,017 | $60,180 | $22,320 | $37,860 |
| 2019 | $5,696 | $61,860 | $22,320 | $39,540 |
| 2018 | $5,502 | $26,990 | $10,866 | $16,124 |
| 2017 | $5,191 | $25,467 | $9,951 | $15,516 |
| 2016 | $4,805 | $24,036 | $9,050 | $14,986 |
| 2015 | $2,898 | $24,036 | $10,340 | $13,696 |
| 2014 | $2,898 | $22,690 | $11,714 | $10,976 |
Source: Public Records
Map
Nearby Homes
Your Personal Tour Guide
Ask me questions while you tour the home.