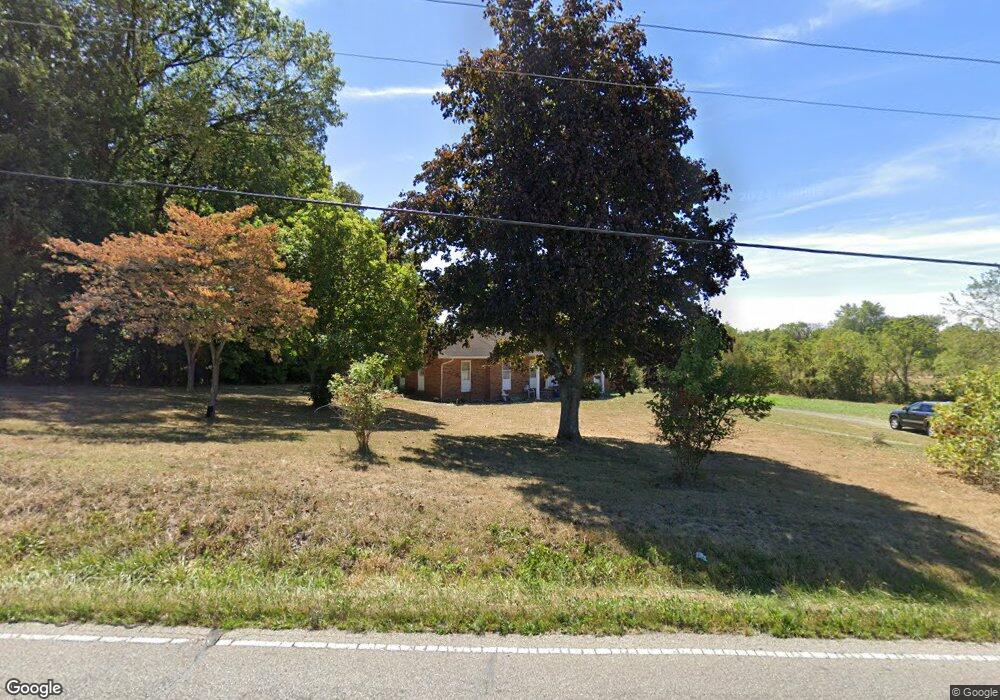
1469 Coonpath Rd NE Lancaster, OH 43130
Estimated Value: $388,485 - $437,000
4
Beds
3
Baths
2,412
Sq Ft
$169/Sq Ft
Est. Value
About This Home
This home is located at 1469 Coonpath Rd NE, Lancaster, OH 43130 and is currently estimated at $406,871, approximately $168 per square foot. 1469 Coonpath Rd NE is a home located in Fairfield County with nearby schools including St Mary Elementary School and William V Fisher Catholic High School.
Ownership History
Date
Name
Owned For
Owner Type
Purchase Details
Closed on
Dec 18, 2001
Sold by
Krause Becky H
Bought by
Frost Richard L
Current Estimated Value
Purchase Details
Closed on
Aug 2, 2000
Sold by
Hajost Leonard L
Bought by
Deboard Randall J and Deboard Mary E
Purchase Details
Closed on
Jul 8, 1999
Sold by
Krause Jack A
Bought by
Hajost Leonard J and Hajost Rosemary
Purchase Details
Closed on
Mar 29, 1999
Sold by
Berens Randall S
Bought by
Krause Jack A and Krause Becky H
Home Financials for this Owner
Home Financials are based on the most recent Mortgage that was taken out on this home.
Original Mortgage
$207,000
Interest Rate
6.85%
Mortgage Type
New Conventional
Purchase Details
Closed on
Sep 4, 1996
Sold by
Fogg Donald E
Bought by
Berens Randall S and Berens Deborah L
Create a Home Valuation Report for This Property
The Home Valuation Report is an in-depth analysis detailing your home's value as well as a comparison with similar homes in the area
Home Values in the Area
Average Home Value in this Area
Purchase History
| Date | Buyer | Sale Price | Title Company |
|---|---|---|---|
| Frost Richard L | $169,000 | -- | |
| Deboard Randall J | $185,000 | -- | |
| Hajost Leonard J | $150,000 | -- | |
| Krause Jack A | $230,000 | -- | |
| Berens Randall S | $190,000 | -- |
Source: Public Records
Mortgage History
| Date | Status | Borrower | Loan Amount |
|---|---|---|---|
| Previous Owner | Krause Jack A | $207,000 |
Source: Public Records
Tax History Compared to Growth
Tax History
| Year | Tax Paid | Tax Assessment Tax Assessment Total Assessment is a certain percentage of the fair market value that is determined by local assessors to be the total taxable value of land and additions on the property. | Land | Improvement |
|---|---|---|---|---|
| 2024 | $10,534 | $108,490 | $24,200 | $84,290 |
| 2023 | $4,003 | $108,490 | $24,200 | $84,290 |
| 2022 | $4,069 | $108,490 | $24,200 | $84,290 |
| 2021 | $3,226 | $85,630 | $22,000 | $63,630 |
| 2020 | $1,022 | $85,630 | $22,000 | $63,630 |
| 2019 | $2,960 | $85,630 | $22,000 | $63,630 |
| 2018 | $1,699 | $76,210 | $21,540 | $54,670 |
| 2017 | $2,750 | $76,210 | $21,540 | $54,670 |
| 2016 | $2,550 | $76,210 | $21,540 | $54,670 |
| 2015 | $2,540 | $73,890 | $21,540 | $52,350 |
| 2014 | $2,424 | $73,890 | $21,540 | $52,350 |
| 2013 | $2,424 | $73,890 | $21,540 | $52,350 |
Source: Public Records
Map
Nearby Homes
- 1750 Coonpath Rd NE Unit Tract 5
- 3155 Old Millersport Rd NE Unit Lot 11
- 0 Tschopp Rd NE Unit Lot 17 225027320
- 0 Tschopp Rd NE Unit Lot 33 225027324
- 2961 Old Millersport Rd NE
- 2444 Sheridan Dr
- 0 Old Millersport Rd NE Unit Tract 8 224028101
- 0 Old Millersport Rd NE Unit Lot 10 225033491
- 0 Old Millersport Rd NE Unit 225010386
- 0 Lucille Dr NE
- 2282 Carper St
- 2149 Pleasantview Dr NE
- 1669 Lexington Dr
- 0 Marquette Dr NE Unit Lot 16 225027323
- 0 Marquette Dr NE Unit Lot 4 225007276
- 2655 Lancaster Thornville Rd NE
- 1801 Pleasantview Dr NE
- 2195 William T Cir
- 1590 Northwood Dr NE
- 0 Fremar Rd NE Unit Lot1 225007256
- 2959 Maradon Ct NE
- 2983 Maradon Ct NE
- 2935 Maradon Ct NE
- 3034 Sarah Dr NE
- 1420 Coonpath Rd NE
- 2911 Maradon Ct NE
- 2978 Maradon Ct NE
- 3055 Sarah Dr NE
- 2950 Maradon Ct NE
- 3076 Sarah Dr NE
- 2918 Maradon Ct NE
- 1591 Coonpath Rd NE
- 1570 Coonpath Rd NE
- 2949 Susalou Ct NE
- 3125 Sarah Dr NE
- 2975 Susalou Ct NE
- 3120 Sarah Dr NE
- 1350 Coonpath Rd NE
- 2941 Susalou Ct NE
- 1340 Coonpath Rd NE