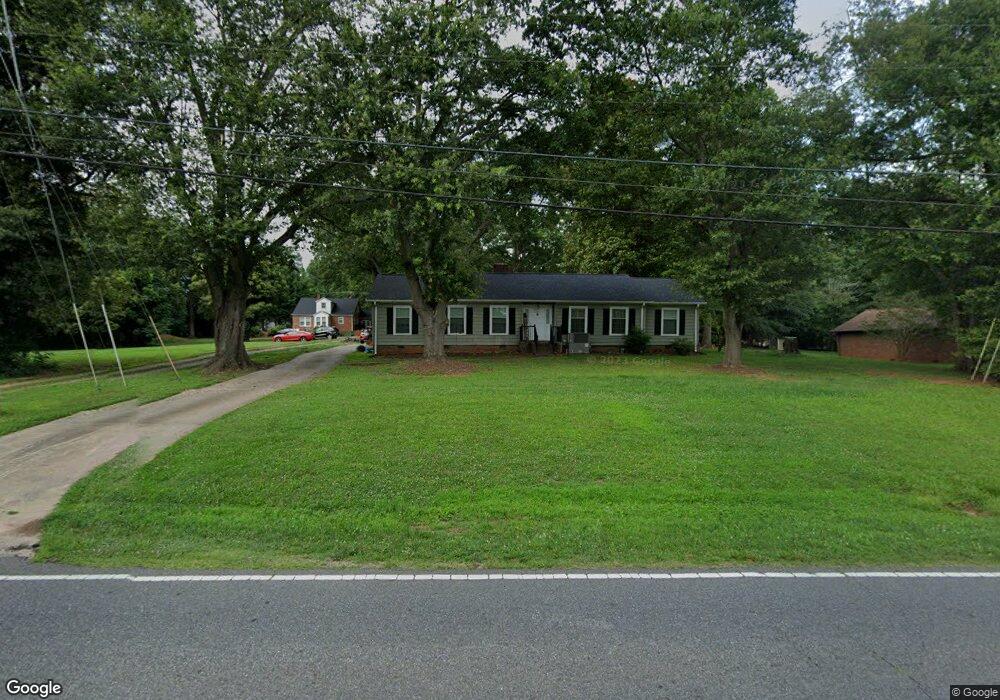
1469 E Marion St Unit 7 Shelby, NC 28150
Estimated Value: $258,000 - $321,000
--
Bed
2
Baths
1,722
Sq Ft
$170/Sq Ft
Est. Value
About This Home
This home is located at 1469 E Marion St Unit 7, Shelby, NC 28150 and is currently estimated at $293,003, approximately $170 per square foot. 1469 E Marion St Unit 7 is a home located in Cleveland County with nearby schools including Marion Intermediate School, Shelby Middle School, and Shelby High School.
Ownership History
Date
Name
Owned For
Owner Type
Purchase Details
Closed on
Dec 31, 2019
Sold by
Ditech Financial Llc
Bought by
White Naima P
Current Estimated Value
Purchase Details
Closed on
Mar 16, 2017
Sold by
Caldwell Caldwell L and Caldwell Jerralene V
Bought by
Barringer Angela Hardin
Home Financials for this Owner
Home Financials are based on the most recent Mortgage that was taken out on this home.
Original Mortgage
$137,464
Interest Rate
4.4%
Mortgage Type
FHA
Purchase Details
Closed on
Feb 11, 2016
Sold by
Earlyfalsom Properties Inc
Bought by
Caldwell L Dewayne and Caldwell Jerralene
Purchase Details
Closed on
Oct 19, 2015
Sold by
Patterson Jeanne Ellnor
Bought by
Early Falsom Properties Inc
Home Financials for this Owner
Home Financials are based on the most recent Mortgage that was taken out on this home.
Original Mortgage
$20,000
Interest Rate
3.78%
Mortgage Type
Purchase Money Mortgage
Create a Home Valuation Report for This Property
The Home Valuation Report is an in-depth analysis detailing your home's value as well as a comparison with similar homes in the area
Home Values in the Area
Average Home Value in this Area
Purchase History
| Date | Buyer | Sale Price | Title Company |
|---|---|---|---|
| White Naima P | $91,200 | Servicelink Llc | |
| Barringer Angela Hardin | $140,000 | None Available | |
| Caldwell L Dewayne | $30,000 | None Available | |
| Early Falsom Properties Inc | $15,716 | None Available |
Source: Public Records
Mortgage History
| Date | Status | Borrower | Loan Amount |
|---|---|---|---|
| Previous Owner | Barringer Angela Hardin | $137,464 | |
| Previous Owner | Early Falsom Properties Inc | $20,000 |
Source: Public Records
Tax History Compared to Growth
Tax History
| Year | Tax Paid | Tax Assessment Tax Assessment Total Assessment is a certain percentage of the fair market value that is determined by local assessors to be the total taxable value of land and additions on the property. | Land | Improvement |
|---|---|---|---|---|
| 2025 | $2,080 | $209,087 | $24,486 | $184,601 |
| 2024 | $1,916 | $156,892 | $23,086 | $133,806 |
| 2023 | $1,906 | $156,892 | $23,086 | $133,806 |
| 2022 | $1,906 | $156,892 | $23,086 | $133,806 |
| 2021 | $1,916 | $156,892 | $23,086 | $133,806 |
| 2020 | $1,375 | $108,890 | $23,086 | $85,804 |
| 2019 | $1,375 | $108,890 | $23,086 | $85,804 |
| 2018 | $1,374 | $108,890 | $23,086 | $85,804 |
| 2017 | $1,340 | $108,890 | $23,086 | $85,804 |
| 2016 | $1,344 | $108,890 | $23,086 | $85,804 |
| 2015 | $1,417 | $121,094 | $23,086 | $98,008 |
| 2014 | $1,417 | $121,094 | $23,086 | $98,008 |
Source: Public Records
Map
Nearby Homes
- 1407 E Marion St
- 505 Mauney Ln
- 316 Country Club Acres None
- 320 Country Club Acres None
- 218 Fairway Dr
- 206 Vauxhall Dr
- 205 Vauxhall Dr
- 1816 Country Garden Dr
- 110 Columns Cir
- 411 Country Club Rd
- 1327 1/2 Crestview Dr
- 403 Murdock Cir
- 1204 Meadowood Dr
- 1805 Isaac Place
- 1410 Deborah Cir
- 1813 Isaac Place
- 504 Johnsfield Rd
- 0 Oates Dr
- 127 Victoria Park Dr
- 115 Sunrise Cir
- 1469 E Marion St
- 1471 E Marion St
- 207 Cleveland Ave
- 209 Cleveland Ave
- 203 Cleveland Ave
- 1467 E Marion St
- 201 Cleveland Ave
- 1465 E Marion St
- 1468 E Marion St
- 1501 E Marion St
- 215 Cleveland Ave
- 212 Cleveland Ave
- 1500 E Marion St
- 208 Cleveland Ave
- 200 Cleveland Ave Unit 1
- 302 Elizabeth Ave
- 302 Elizabeth Ave
- 208 Elizabeth Ave
- 1503 E Marion St
- 308 Elizabeth Ave