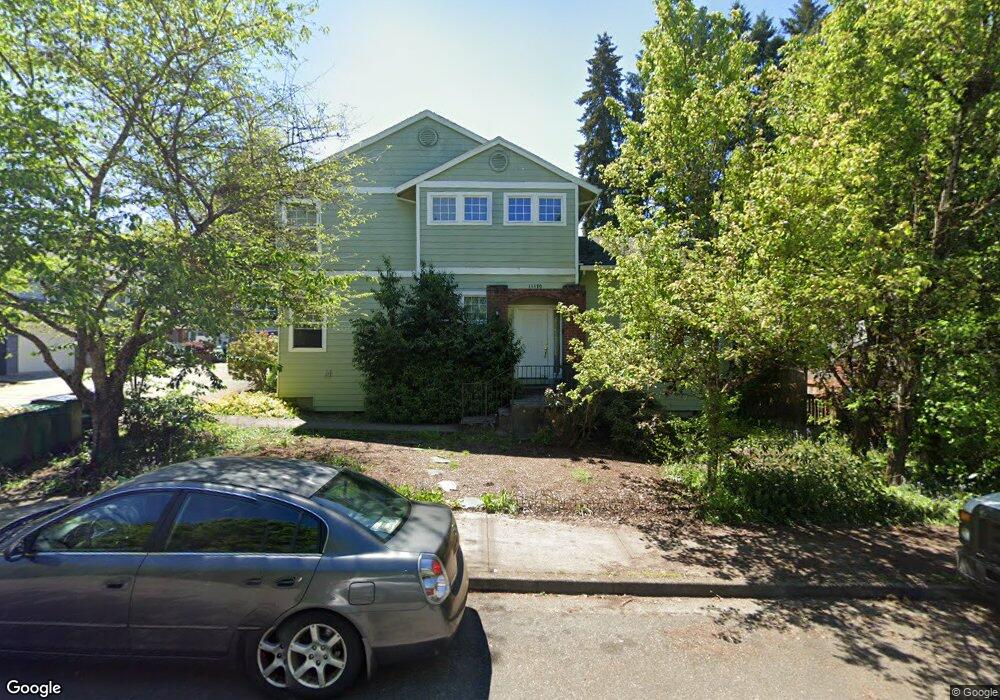
14690 SW 6th St Beaverton, OR 97007
West Beaverton NeighborhoodEstimated Value: $439,000 - $611,000
3
Beds
3
Baths
1,662
Sq Ft
$308/Sq Ft
Est. Value
About This Home
This home is located at 14690 SW 6th St, Beaverton, OR 97007 and is currently estimated at $511,922, approximately $308 per square foot. 14690 SW 6th St is a home located in Washington County with nearby schools including Chehalem Elementary School, Mountain View Middle School, and Mountainside High School.
Ownership History
Date
Name
Owned For
Owner Type
Purchase Details
Closed on
Jun 11, 2021
Sold by
Deleon Ronald Torres
Bought by
Deleon Kanitha Chan
Current Estimated Value
Purchase Details
Closed on
Jan 27, 2018
Sold by
Deleon Kanitha De
Bought by
Leon Kanthia Chan De and Leon Ronald Torres De
Purchase Details
Closed on
Jan 19, 2017
Sold by
Deleon Kanitha and Chan Kanitha P
Bought by
Deleon Kanitha
Home Financials for this Owner
Home Financials are based on the most recent Mortgage that was taken out on this home.
Original Mortgage
$174,400
Outstanding Balance
$85,896
Interest Rate
4.13%
Mortgage Type
New Conventional
Estimated Equity
$426,026
Purchase Details
Closed on
Dec 2, 1999
Sold by
Emerald Engineers & Contructors Inc
Bought by
Chan Kanitha P
Home Financials for this Owner
Home Financials are based on the most recent Mortgage that was taken out on this home.
Original Mortgage
$156,600
Interest Rate
7.95%
Create a Home Valuation Report for This Property
The Home Valuation Report is an in-depth analysis detailing your home's value as well as a comparison with similar homes in the area
Home Values in the Area
Average Home Value in this Area
Purchase History
| Date | Buyer | Sale Price | Title Company |
|---|---|---|---|
| Deleon Kanitha Chan | -- | Fidelity National Ttl Of Or | |
| Leon Kanthia Chan De | -- | None Available | |
| Deleon Kanitha | -- | First American | |
| Chan Kanitha P | $174,000 | Pacific Nw Title |
Source: Public Records
Mortgage History
| Date | Status | Borrower | Loan Amount |
|---|---|---|---|
| Open | Deleon Kanitha | $174,400 | |
| Closed | Chan Kanitha P | $156,600 |
Source: Public Records
Tax History Compared to Growth
Tax History
| Year | Tax Paid | Tax Assessment Tax Assessment Total Assessment is a certain percentage of the fair market value that is determined by local assessors to be the total taxable value of land and additions on the property. | Land | Improvement |
|---|---|---|---|---|
| 2026 | $6,236 | $304,420 | -- | -- |
| 2025 | $6,236 | $295,560 | -- | -- |
| 2024 | $5,888 | $286,960 | -- | -- |
| 2023 | $5,888 | $278,610 | $0 | $0 |
| 2022 | $5,635 | $278,610 | $0 | $0 |
| 2021 | $5,438 | $262,630 | $0 | $0 |
| 2020 | $5,273 | $254,990 | $0 | $0 |
| 2019 | $5,106 | $247,570 | $0 | $0 |
| 2018 | $4,943 | $240,360 | $0 | $0 |
| 2017 | $4,758 | $233,360 | $0 | $0 |
| 2016 | $4,593 | $226,570 | $0 | $0 |
| 2015 | $4,352 | $219,980 | $0 | $0 |
| 2014 | $4,296 | $213,580 | $0 | $0 |
Source: Public Records
Map
Nearby Homes
- 5000 SW 149th Ave
- 5458 SW Murray Blvd Unit IV21
- 15000 SW Farmington Rd Unit 30
- 5502 SW Murray Blvd
- 5206 SW Barclay Ct
- 5375 SW Barclay Ct
- 5279 SW 153rd Ave
- 15130 SW Village Ln
- 5625 SW Rockwood Ct
- 14861 SW Daphne Ct
- 6025 SW Cherryhill Dr
- 15390 SW Davis Rd
- 18038 SW Alvord Ln
- 14350 SW 22nd St
- 6155 SW Shannon Ct
- 6170 SW Heights Ln
- 13331 SW Allen Blvd Unit 13331
- 13325 SW Larson St
- 6097 SW Valley Ave
- 6939 SW 148th Ct
- 14690 SW 6th Twnhm Alternativ
- 14680 SW 6th Twnhm Alternativ
- 14680 SW 6th St
- 14670 SW 6th St
- 14650 SW 6th St
- 14670 SW 6th Twnhm Alternativ
- 14710 SW 6th St
- 14660 SW 6th St
- 14660 SW 6th Twnhm Alternativ
- 14610 SW 6th St
- 14571 SW 6th St
- 14563 SW 6th St
- 14760 SW 6th St
- 14557 SW 6th St
- 14750 SW Redbud Way
- 14751 SW Redbud Way
- 14755 SW 6th St
- 14740 SW Redbud Way
- 14780 SW 6th St
- 14550 SW 6th St