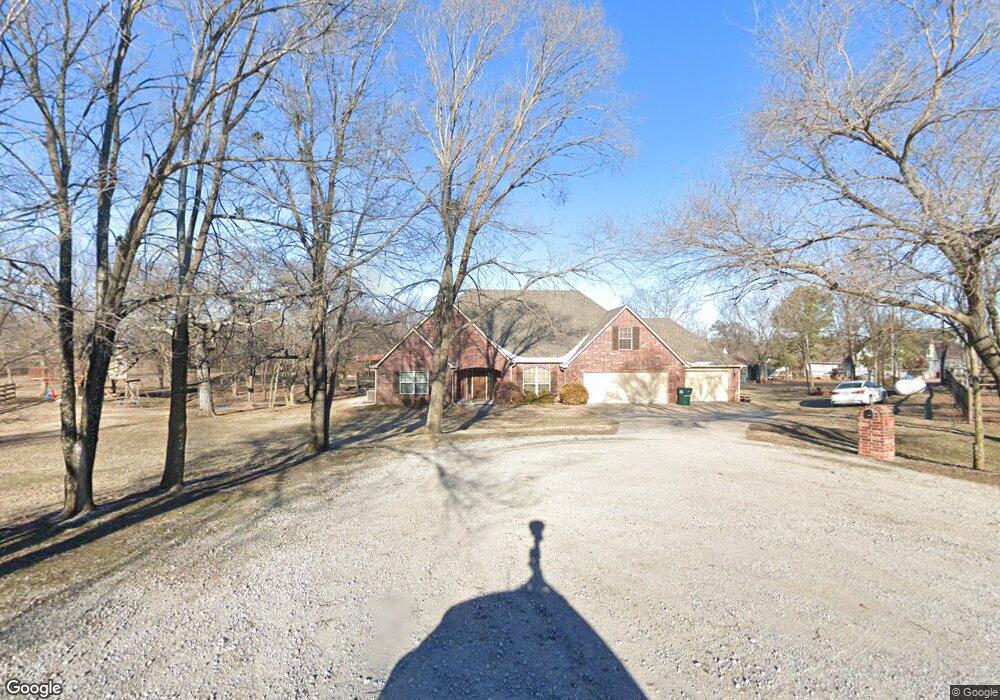
14693 E 470 Place Claremore, OK 74017
Estimated Value: $490,122 - $562,000
3
Beds
2
Baths
2,305
Sq Ft
$231/Sq Ft
Est. Value
About This Home
This home is located at 14693 E 470 Place, Claremore, OK 74017 and is currently estimated at $533,031, approximately $231 per square foot. 14693 E 470 Place is a home located in Rogers County with nearby schools including Justus-Tiawah Public School, Claremore Christian School, and Heritage Adventist School.
Ownership History
Date
Name
Owned For
Owner Type
Purchase Details
Closed on
Oct 18, 2016
Sold by
Corporate Relocation Llc
Bought by
Shearer Lucas and Shearer Emily
Current Estimated Value
Home Financials for this Owner
Home Financials are based on the most recent Mortgage that was taken out on this home.
Original Mortgage
$335,725
Outstanding Balance
$268,042
Interest Rate
3.5%
Mortgage Type
VA
Estimated Equity
$264,989
Purchase Details
Closed on
Jun 12, 2014
Sold by
Colvard Jeremy
Bought by
Harvey Jyme B and Harvey Michael D
Purchase Details
Closed on
Nov 18, 2011
Sold by
Redwood Construction Inc
Bought by
Colvard Jeremy and Colvard Jennifer
Home Financials for this Owner
Home Financials are based on the most recent Mortgage that was taken out on this home.
Original Mortgage
$255,151
Interest Rate
4.15%
Mortgage Type
VA
Create a Home Valuation Report for This Property
The Home Valuation Report is an in-depth analysis detailing your home's value as well as a comparison with similar homes in the area
Home Values in the Area
Average Home Value in this Area
Purchase History
| Date | Buyer | Sale Price | Title Company |
|---|---|---|---|
| Shearer Lucas | $325,000 | None Available | |
| Harvey Jyme B | $335,000 | -- | |
| Colvard Jeremy | $247,000 | Executives Title & Escrow Co |
Source: Public Records
Mortgage History
| Date | Status | Borrower | Loan Amount |
|---|---|---|---|
| Open | Shearer Lucas | $335,725 | |
| Previous Owner | Colvard Jeremy | $255,151 |
Source: Public Records
Tax History Compared to Growth
Tax History
| Year | Tax Paid | Tax Assessment Tax Assessment Total Assessment is a certain percentage of the fair market value that is determined by local assessors to be the total taxable value of land and additions on the property. | Land | Improvement |
|---|---|---|---|---|
| 2025 | $3,369 | $41,569 | $7,818 | $33,751 |
| 2024 | $3,369 | $41,367 | $7,818 | $33,549 |
| 2023 | $3,369 | $40,164 | $9,859 | $30,305 |
| 2022 | $3,160 | $38,993 | $9,821 | $29,172 |
| 2021 | $3,127 | $38,486 | $9,966 | $28,520 |
| 2020 | $3,027 | $37,625 | $9,643 | $27,982 |
| 2019 | $3,004 | $35,685 | $9,265 | $26,420 |
| 2018 | $3,055 | $36,245 | $9,265 | $26,980 |
| 2017 | $2,854 | $35,989 | $9,265 | $26,724 |
| 2016 | $3,010 | $36,293 | $9,265 | $27,028 |
| 2015 | $2,949 | $35,364 | $9,265 | $26,099 |
| 2014 | $2,451 | $29,565 | $5,583 | $23,982 |
Source: Public Records
Map
Nearby Homes
- 14552 E Lake Dr
- 9251 E 470 Rd
- 19434 S Quail Run Ct
- 18723 S 4185 Rd Unit A
- 19805 S Lake Dr
- 18870 Timberlake
- 19962 S Windridge Dr
- 17791 S 4180 Rd
- 19985 S Wind Ridge Dr
- 18954 S Hisaw Dr
- 14800 Cedar Dr
- 1805 NE Oakridge Dr
- 2701 Spring Creek St
- 13414 E 463 Rd
- 1921 Bristol Rd
- 18774 S Birch Hollow Way
- 531 Buckingham Dr
- 1210 Parkland Ave
- 1027 N Miller Dr
- 17995 S 4160 Rd
- 14693 E 470 Place
- 14694 E 470 Place
- 14711 E 470 Rd
- 14490 E Lake Dr
- 14405 S Lake Dr
- 14711 E 470 Place
- 14825 E Lake Place
- 14805 E Lake Place
- 14502 E Lake Dr
- 14636 E Lake Place
- 14426 E Lake Dr
- 14755 E Lake Place
- 14845 E Lake Place
- 14344 E Lake Dr
- 14306 E Lake Dr
- 14500 E Lake Dr
- 14605 E Lake Dr
- 14252 E Lake Dr
- 14881 E Lake Dr
- 14995 E Lake Dr Unit B