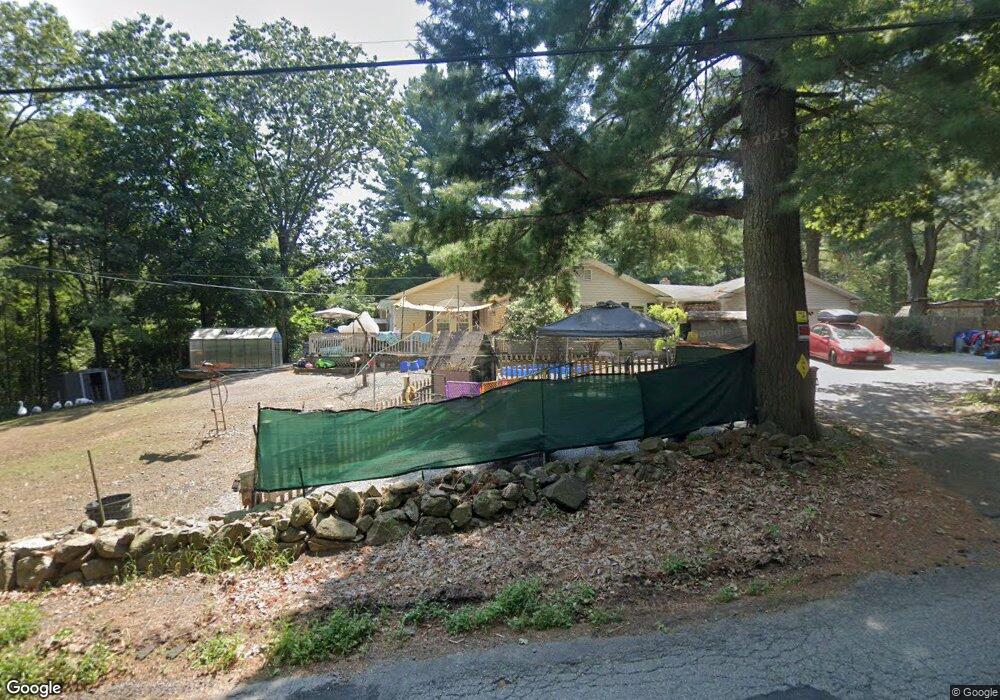
147 Arnold St Wrentham, MA 02093
West Wrentham NeighborhoodEstimated Value: $604,000 - $689,000
4
Beds
2
Baths
1,739
Sq Ft
$378/Sq Ft
Est. Value
About This Home
This home is located at 147 Arnold St, Wrentham, MA 02093 and is currently estimated at $657,140, approximately $377 per square foot. 147 Arnold St is a home located in Norfolk County with nearby schools including Delaney Elementary School, Charles E Roderick, and Mercymount Country Day School.
Ownership History
Date
Name
Owned For
Owner Type
Purchase Details
Closed on
Nov 22, 2017
Sold by
King Christopher W
Bought by
Paglia James
Current Estimated Value
Purchase Details
Closed on
Oct 24, 2008
Sold by
Vatter Gary
Bought by
King Christopher W
Home Financials for this Owner
Home Financials are based on the most recent Mortgage that was taken out on this home.
Original Mortgage
$258,400
Interest Rate
5.94%
Mortgage Type
Purchase Money Mortgage
Purchase Details
Closed on
Apr 14, 2005
Sold by
Nuissl Margot S
Bought by
Vatter Gary
Purchase Details
Closed on
Jan 25, 1991
Sold by
Land Inc
Bought by
Nuissl Carl W and Nuissl Margot S
Create a Home Valuation Report for This Property
The Home Valuation Report is an in-depth analysis detailing your home's value as well as a comparison with similar homes in the area
Home Values in the Area
Average Home Value in this Area
Purchase History
| Date | Buyer | Sale Price | Title Company |
|---|---|---|---|
| Paglia James | $355,000 | -- | |
| King Christopher W | $323,000 | -- | |
| Vatter Gary | $394,900 | -- | |
| Nuissl Carl W | $275,000 | -- |
Source: Public Records
Mortgage History
| Date | Status | Borrower | Loan Amount |
|---|---|---|---|
| Previous Owner | Nuissl Carl W | $25,000 | |
| Previous Owner | Nuissl Carl W | $259,802 | |
| Previous Owner | King Christopher W | $258,400 |
Source: Public Records
Tax History
| Year | Tax Paid | Tax Assessment Tax Assessment Total Assessment is a certain percentage of the fair market value that is determined by local assessors to be the total taxable value of land and additions on the property. | Land | Improvement |
|---|---|---|---|---|
| 2025 | $6,212 | $536,000 | $288,800 | $247,200 |
| 2024 | $5,886 | $490,500 | $288,800 | $201,700 |
| 2023 | $5,658 | $448,300 | $262,700 | $185,600 |
| 2022 | $5,870 | $429,400 | $255,900 | $173,500 |
| 2021 | $5,693 | $404,600 | $239,200 | $165,400 |
| 2020 | $4,886 | $342,900 | $182,800 | $160,100 |
| 2019 | $4,804 | $340,200 | $182,800 | $157,400 |
| 2018 | $4,581 | $321,700 | $173,500 | $148,200 |
| 2017 | $4,315 | $302,800 | $170,200 | $132,600 |
| 2016 | $4,217 | $295,300 | $165,300 | $130,000 |
| 2015 | $4,033 | $269,200 | $158,900 | $110,300 |
| 2014 | $3,965 | $259,000 | $152,800 | $106,200 |
Source: Public Records
Map
Nearby Homes
Your Personal Tour Guide
Ask me questions while you tour the home.