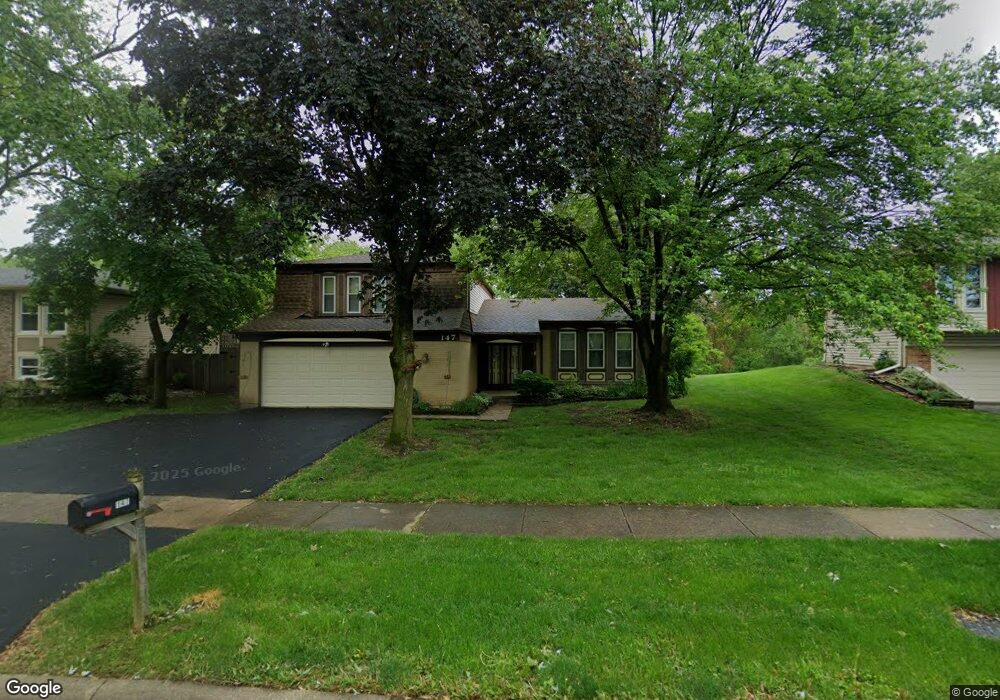
147 Camelot Way Bolingbrook, IL 60440
East Bolingbrook NeighborhoodEstimated Value: $365,000 - $390,000
--
Bed
1
Bath
2,002
Sq Ft
$191/Sq Ft
Est. Value
About This Home
This home is located at 147 Camelot Way, Bolingbrook, IL 60440 and is currently estimated at $382,009, approximately $190 per square foot. 147 Camelot Way is a home located in Will County with nearby schools including Jonas E Salk Elementary School, Hubert H Humphrey Middle School, and Brooks Middle School.
Ownership History
Date
Name
Owned For
Owner Type
Purchase Details
Closed on
Jun 30, 2014
Sold by
Metz Belinda
Bought by
Belinda Metz Trust
Current Estimated Value
Purchase Details
Closed on
Dec 6, 2012
Sold by
Varner Belinda Metz and Metz Belinda
Bought by
Metz Belinda
Home Financials for this Owner
Home Financials are based on the most recent Mortgage that was taken out on this home.
Original Mortgage
$109,500
Outstanding Balance
$75,651
Interest Rate
3.31%
Mortgage Type
New Conventional
Estimated Equity
$306,358
Purchase Details
Closed on
Oct 14, 2003
Sold by
Village Of Bolingbrook
Bought by
Metz Varner Belinda
Purchase Details
Closed on
Sep 29, 2000
Sold by
Stevens Robert B and Stevens Rita J
Bought by
Metz Varner Belinda
Home Financials for this Owner
Home Financials are based on the most recent Mortgage that was taken out on this home.
Original Mortgage
$128,800
Interest Rate
7.99%
Create a Home Valuation Report for This Property
The Home Valuation Report is an in-depth analysis detailing your home's value as well as a comparison with similar homes in the area
Home Values in the Area
Average Home Value in this Area
Purchase History
| Date | Buyer | Sale Price | Title Company |
|---|---|---|---|
| Belinda Metz Trust | -- | None Available | |
| Metz Belinda | -- | Citywide Title Corporation | |
| Metz Varner Belinda | -- | -- | |
| Metz Varner Belinda | $161,000 | -- |
Source: Public Records
Mortgage History
| Date | Status | Borrower | Loan Amount |
|---|---|---|---|
| Open | Metz Belinda | $109,500 | |
| Previous Owner | Metz Varner Belinda | $128,800 |
Source: Public Records
Tax History Compared to Growth
Tax History
| Year | Tax Paid | Tax Assessment Tax Assessment Total Assessment is a certain percentage of the fair market value that is determined by local assessors to be the total taxable value of land and additions on the property. | Land | Improvement |
|---|---|---|---|---|
| 2024 | $10,520 | $121,907 | $22,416 | $99,491 |
| 2023 | $10,520 | $109,688 | $20,169 | $89,519 |
| 2022 | $9,182 | $98,889 | $18,183 | $80,706 |
| 2021 | $8,705 | $92,462 | $17,001 | $75,461 |
| 2020 | $8,438 | $89,422 | $16,442 | $72,980 |
| 2019 | $8,168 | $85,164 | $15,659 | $69,505 |
| 2018 | $7,515 | $78,356 | $14,408 | $63,948 |
| 2017 | $7,155 | $74,271 | $13,657 | $60,614 |
| 2016 | $6,948 | $70,700 | $13,000 | $57,700 |
| 2015 | $5,794 | $65,800 | $12,100 | $53,700 |
| 2014 | $5,794 | $59,800 | $11,000 | $48,800 |
| 2013 | $5,794 | $59,800 | $11,000 | $48,800 |
Source: Public Records
Map
Nearby Homes
- 233 Malibu Dr Unit 4
- 220 Falcon Ridge Way
- 124 Wedgewood Way
- 308 Pacific Dr
- 492 Ridge Ln
- 490 Ridge Ln
- 488 Ridge Ln
- 109 Arrowhead Ln
- 316 Bedford Rd
- 458 Ridge Ln
- 462 Ridge Ln
- Kenmore Plan at Bluebell Ridge
- Lockwood Plan at Bluebell Ridge
- 325 Rockhurst Rd
- 181 W Robinhood Way Unit 5
- 112 Brook Ct
- 460 Michelangelo Dr
- 424 Van Gogh Cir Unit 1
- 168 Bedford Rd
- 222 Aspen Ct
- 149 Camelot Way
- 145 Camelot Way
- 151 Camelot Way
- 143 Camelot Way
- 309 Malibu Dr
- 140 Camelot Way
- 153 Camelot Way
- 313 Malibu Dr
- 152 Rockhurst Rd
- 305 Malibu Dr
- 141 Camelot Way
- 317 Malibu Dr
- 159 Camelot Way
- 127 E Robinhood Way
- 148 Rockhurst Rd
- 152 Camelot Way
- 136 Camelot Way
- 137 Camelot Way
- 144 Rockhurst Rd
- 321 Malibu Dr