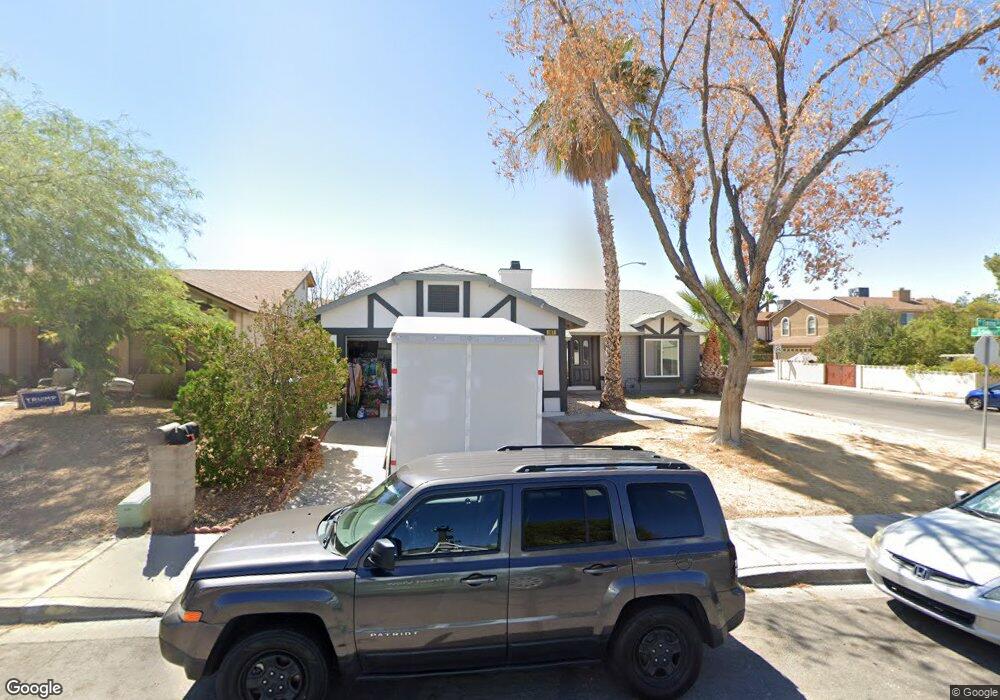
147 Emden Dr Henderson, NV 89015
Foothills NeighborhoodEstimated Value: $331,000 - $424,000
3
Beds
2
Baths
1,450
Sq Ft
$259/Sq Ft
Est. Value
About This Home
This home is located at 147 Emden Dr, Henderson, NV 89015 and is currently estimated at $375,483, approximately $258 per square foot. 147 Emden Dr is a home located in Clark County with nearby schools including Sue H. Morrow Elementary School, B Mahlon Brown Academy of International Studies, and Basic Academy of International Studies.
Ownership History
Date
Name
Owned For
Owner Type
Purchase Details
Closed on
Apr 11, 2025
Sold by
Markus Cynthia A and Markus James J
Bought by
Markus Family Revocable Living Trust and Markus
Current Estimated Value
Purchase Details
Closed on
Feb 5, 2004
Sold by
Markus James J
Bought by
Markus Cynthia A and Markus James J
Purchase Details
Closed on
Jul 24, 2002
Sold by
Markus James J and Markus Cynthia O
Bought by
Markus James J
Purchase Details
Closed on
May 4, 2001
Sold by
Markus James J
Bought by
Markus James J and Jones Cynthia O
Purchase Details
Closed on
Jul 18, 2000
Sold by
Montoya Jose G and Montoya Martha R
Bought by
Markos James J
Home Financials for this Owner
Home Financials are based on the most recent Mortgage that was taken out on this home.
Original Mortgage
$131,123
Interest Rate
8.2%
Mortgage Type
FHA
Create a Home Valuation Report for This Property
The Home Valuation Report is an in-depth analysis detailing your home's value as well as a comparison with similar homes in the area
Home Values in the Area
Average Home Value in this Area
Purchase History
| Date | Buyer | Sale Price | Title Company |
|---|---|---|---|
| Markus Family Revocable Living Trust | -- | None Listed On Document | |
| Markus Cynthia A | -- | -- | |
| Markus James J | -- | Stewart Title | |
| Markus James J | -- | Stewart Title | |
| Markus James J | $132,000 | -- | |
| Markos James J | $132,000 | Old Republic Title Company |
Source: Public Records
Mortgage History
| Date | Status | Borrower | Loan Amount |
|---|---|---|---|
| Previous Owner | Markos James J | $131,123 |
Source: Public Records
Tax History
| Year | Tax Paid | Tax Assessment Tax Assessment Total Assessment is a certain percentage of the fair market value that is determined by local assessors to be the total taxable value of land and additions on the property. | Land | Improvement |
|---|---|---|---|---|
| 2026 | $1,064 | $69,020 | $32,550 | $36,470 |
| 2025 | $1,032 | $65,658 | $28,000 | $37,658 |
| 2024 | $1,003 | $65,658 | $28,000 | $37,658 |
| 2023 | $1,003 | $65,603 | $29,050 | $36,553 |
| 2022 | $974 | $60,755 | $26,950 | $33,805 |
| 2021 | $945 | $54,213 | $21,700 | $32,513 |
| 2020 | $915 | $53,566 | $21,000 | $32,566 |
| 2019 | $904 | $51,709 | $19,250 | $32,459 |
| 2018 | $862 | $47,625 | $16,100 | $31,525 |
| 2017 | $1,351 | $46,498 | $14,350 | $32,148 |
| 2016 | $808 | $40,395 | $7,700 | $32,695 |
| 2015 | $806 | $31,805 | $7,700 | $24,105 |
| 2014 | $782 | $26,620 | $7,000 | $19,620 |
Source: Public Records
Map
Nearby Homes
- 152 Emden Dr
- 826 Anchor Dr
- 200 Oleander Place
- 918 Clipper Dr
- 163 Spinnaker Dr
- 926 Anchor Dr
- 260 Prairie Rose St
- 412 Cindy Place
- 915 N Major Ave
- 907 N Major Ave
- 206 Valerian St
- 865 Bussora Rose Dr
- 252 Hull St
- 846 Fairview Dr
- 128 Ringlore Dr
- 839 Fairview Dr
- 1003 Palo Verde Dr
- 235 Winona Dr
- 923 Highland Trails Ave
- 737 Thorton Beach St
- 149 Emden Dr
- 100 Spinnaker Dr
- 100 Spinnaker Dr Unit 1
- 151 Emden Dr Unit 1
- 102 Spinnaker Dr
- 143 Emden Dr
- 104 Spinnaker Dr
- 800 Schooner Dr
- 106 Spinnaker Dr
- 148 Emden Dr
- 146 Emden Dr
- 153 Emden Dr
- 150 Emden Dr
- 802 Schooner Dr
- 108 Spinnaker Dr
- 144 Emden Dr
- 152 Emden Dr Unit none
- 152 Emden Dr Unit n/a
- 804 Schooner Dr
- 155 Emden Dr
Your Personal Tour Guide
Ask me questions while you tour the home.