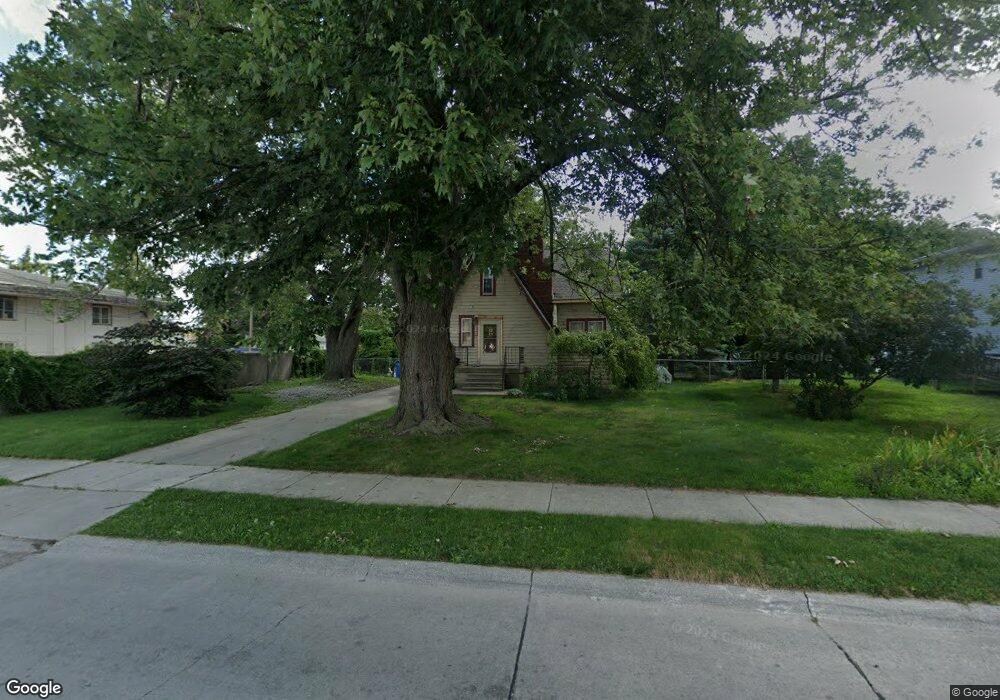
147 Helen St Inkster, MI 48141
Estimated Value: $108,000 - $126,034
--
Bed
2
Baths
1,050
Sq Ft
$110/Sq Ft
Est. Value
About This Home
This home is located at 147 Helen St, Inkster, MI 48141 and is currently estimated at $116,009, approximately $110 per square foot. 147 Helen St is a home located in Wayne County with nearby schools including David Hicks School, Marshall Upper Elementary School, and John Glenn High School.
Ownership History
Date
Name
Owned For
Owner Type
Purchase Details
Closed on
Oct 21, 2024
Sold by
Stark James A and Stark Hillary D
Bought by
Saab Investment Co Llc
Current Estimated Value
Home Financials for this Owner
Home Financials are based on the most recent Mortgage that was taken out on this home.
Original Mortgage
$137,500
Outstanding Balance
$136,726
Interest Rate
9.5%
Mortgage Type
New Conventional
Estimated Equity
-$20,717
Purchase Details
Closed on
Feb 7, 2023
Sold by
Stark James A
Bought by
Stark James A and Stark Hillary D
Purchase Details
Closed on
Feb 3, 2023
Sold by
Rusnak Kathleen
Bought by
Stark James A
Purchase Details
Closed on
Jul 21, 2000
Sold by
Nordwall Gary L
Bought by
Rusnak Kathleen
Purchase Details
Closed on
Dec 3, 1998
Sold by
Pankow Beverly A
Bought by
Nordwall Gary L
Purchase Details
Closed on
Oct 4, 1994
Sold by
Wormall Beverly A
Bought by
Gary L and Nordwall Laura L
Create a Home Valuation Report for This Property
The Home Valuation Report is an in-depth analysis detailing your home's value as well as a comparison with similar homes in the area
Home Values in the Area
Average Home Value in this Area
Purchase History
| Date | Buyer | Sale Price | Title Company |
|---|---|---|---|
| Saab Investment Co Llc | $85,000 | None Listed On Document | |
| Saab Investment Co Llc | $85,000 | None Listed On Document | |
| Stark James A | -- | -- | |
| Stark James A | -- | -- | |
| Rusnak Kathleen | $86,000 | -- | |
| Nordwall Gary L | $31,000 | -- | |
| Gary L | -- | -- |
Source: Public Records
Mortgage History
| Date | Status | Borrower | Loan Amount |
|---|---|---|---|
| Open | Saab Investment Co Llc | $137,500 | |
| Closed | Saab Investment Co Llc | $137,500 |
Source: Public Records
Tax History Compared to Growth
Tax History
| Year | Tax Paid | Tax Assessment Tax Assessment Total Assessment is a certain percentage of the fair market value that is determined by local assessors to be the total taxable value of land and additions on the property. | Land | Improvement |
|---|---|---|---|---|
| 2025 | $1,020 | $47,400 | $0 | $0 |
| 2024 | $1,020 | $39,600 | $0 | $0 |
| 2023 | $1,019 | $32,200 | $0 | $0 |
| 2022 | $1,268 | $26,600 | $0 | $0 |
| 2021 | $1,339 | $24,100 | $0 | $0 |
| 2020 | $1,307 | $20,900 | $0 | $0 |
| 2019 | $1,303 | $17,700 | $0 | $0 |
| 2018 | $925 | $16,000 | $0 | $0 |
| 2017 | $535 | $15,500 | $0 | $0 |
| 2016 | $1,308 | $16,000 | $0 | $0 |
| 2015 | $1,590 | $15,900 | $0 | $0 |
| 2013 | $2,150 | $21,500 | $0 | $0 |
| 2012 | $1,340 | $24,400 | $4,100 | $20,300 |
Source: Public Records
Map
Nearby Homes
- 201 Cardwell St
- 120 Lathers St
- 233 Magnolia Dr
- 251 Helen St
- 375 Arcola St
- 537 Helen St
- VACANT LOT Tromley St
- 391 Arcola St
- 622 Tromley St
- 28432 Alvin St
- 720 Magnolia Dr
- 641 Gilman St
- 28058 Avondale St
- 28315 Sheridan St
- 28783 Leona St
- 27805 Avondale St
- 27566 Sheridan St
- 1049 Woodland Dr
- 27534 Sheridan St
- 420 Fairwood St
- 155 Helen St
- 27857 Cherry Hill Rd
- 221 Helen St
- 237 Helen St
- 236 Helen St
- 255 Helen St
- 102 Helen St
- 27749 Cherry Hill Rd
- 103 Deering St
- 120 Helen St
- 103 Helen St
- 265 Helen St
- 248 Helen St
- 27725 Cherry Hill Rd Unit Bldg-Unit
- 27725 Cherry Hill Rd
- 121 Deering St
- 102 Gilman St
- 120 Gilman St
- 121 Helen St
- 196 Cardwell St