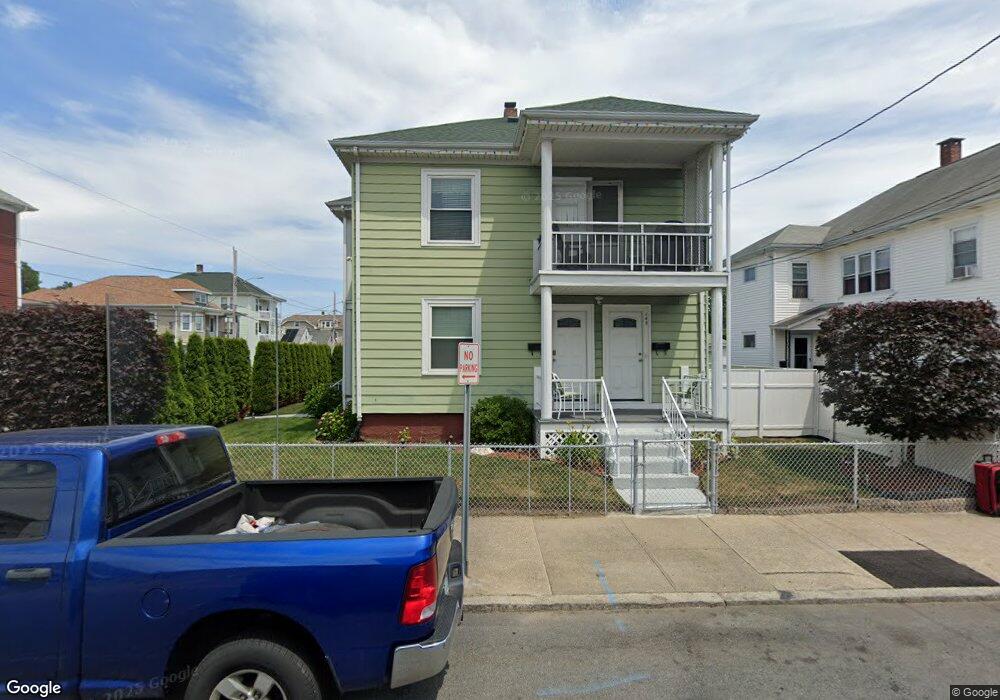
147 Sabin St Pawtucket, RI 02860
Pleasant View NeighborhoodEstimated Value: $431,133 - $549,000
5
Beds
2
Baths
1,898
Sq Ft
$256/Sq Ft
Est. Value
About This Home
This home is located at 147 Sabin St, Pawtucket, RI 02860 and is currently estimated at $486,033, approximately $256 per square foot. 147 Sabin St is a home located in Providence County with nearby schools including St Cecilia School and Saint Raphael Academy.
Ownership History
Date
Name
Owned For
Owner Type
Purchase Details
Closed on
Mar 2, 2018
Sold by
Reyes Raul A and Herrera Raul A
Bought by
Reyes Raul A and Ramos Wanda I
Current Estimated Value
Purchase Details
Closed on
Sep 9, 2013
Sold by
Herrera Raul A
Bought by
Ramos Wanda I and Reyes Raul A
Home Financials for this Owner
Home Financials are based on the most recent Mortgage that was taken out on this home.
Original Mortgage
$152,192
Interest Rate
4.4%
Mortgage Type
New Conventional
Purchase Details
Closed on
Aug 28, 2013
Sold by
Gilbert Lee
Bought by
Herrera Raul A
Home Financials for this Owner
Home Financials are based on the most recent Mortgage that was taken out on this home.
Original Mortgage
$152,192
Interest Rate
4.4%
Mortgage Type
New Conventional
Purchase Details
Closed on
Jul 30, 2001
Sold by
Goyette Constance R
Bought by
Gilbert Lee and Gilbert Suzanne
Home Financials for this Owner
Home Financials are based on the most recent Mortgage that was taken out on this home.
Original Mortgage
$80,000
Interest Rate
7.18%
Create a Home Valuation Report for This Property
The Home Valuation Report is an in-depth analysis detailing your home's value as well as a comparison with similar homes in the area
Home Values in the Area
Average Home Value in this Area
Purchase History
| Date | Buyer | Sale Price | Title Company |
|---|---|---|---|
| Reyes Raul A | -- | -- | |
| Ramos Wanda I | -- | -- | |
| Herrera Raul A | $155,000 | -- | |
| Gilbert Lee | $85,000 | -- |
Source: Public Records
Mortgage History
| Date | Status | Borrower | Loan Amount |
|---|---|---|---|
| Previous Owner | Gilbert Lee | $152,192 | |
| Previous Owner | Gilbert Lee | $76,000 | |
| Previous Owner | Gilbert Lee | $25,000 | |
| Previous Owner | Gilbert Lee | $80,000 |
Source: Public Records
Tax History Compared to Growth
Tax History
| Year | Tax Paid | Tax Assessment Tax Assessment Total Assessment is a certain percentage of the fair market value that is determined by local assessors to be the total taxable value of land and additions on the property. | Land | Improvement |
|---|---|---|---|---|
| 2025 | $4,988 | $379,300 | $128,000 | $251,300 |
| 2024 | $4,681 | $379,300 | $128,000 | $251,300 |
| 2023 | $4,135 | $244,100 | $64,300 | $179,800 |
| 2022 | $4,047 | $244,100 | $64,300 | $179,800 |
| 2021 | $4,047 | $244,100 | $64,300 | $179,800 |
| 2020 | $3,530 | $169,000 | $47,400 | $121,600 |
| 2019 | $3,530 | $169,000 | $47,400 | $121,600 |
| 2018 | $3,402 | $169,000 | $47,400 | $121,600 |
| 2017 | $3,197 | $140,700 | $41,200 | $99,500 |
| 2016 | $3,080 | $140,700 | $41,200 | $99,500 |
| 2015 | $3,080 | $140,700 | $41,200 | $99,500 |
| 2014 | $2,995 | $129,900 | $41,200 | $88,700 |
Source: Public Records
Map
Nearby Homes
- 211 Carnation St
- 54 Sabin St
- 39 Webster St Unit 204
- 176 Central Ave
- 168 Central Ave
- 50 Carnation St Unit 2
- 147 Coyle Ave
- 27 Collins Ave
- 300 Front St Unit 105
- 27 Aiken St
- 19 Lodi St
- 19 Wood St
- 179 Columbine Ave
- 71 Lyon St
- 511 High St
- 517 High St
- 396 Roosevelt Ave
- 79 Turner St
- 207 Benefit St
- 574 Central Ave